
Lesson 2
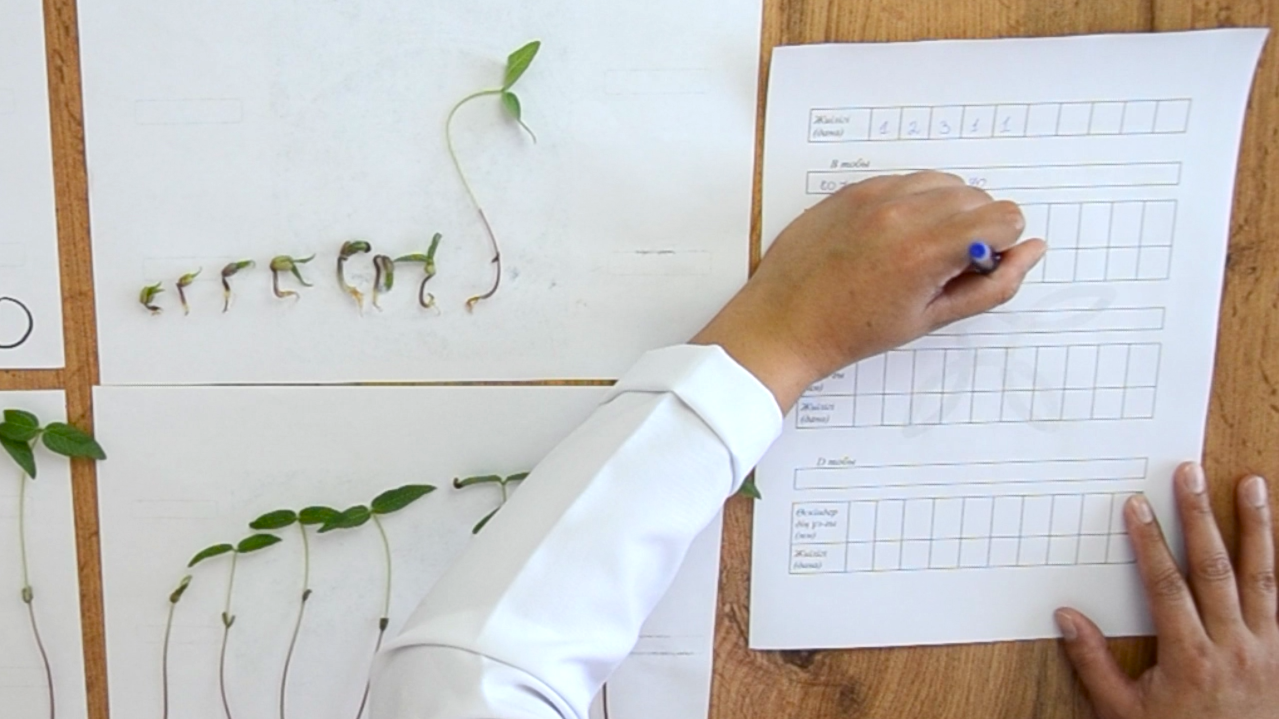
Step 1. After several days, observe the seedlings. Record the stem length, the presence and condition of leaves, and their coloration.
In this experiment, the following results were obtained:
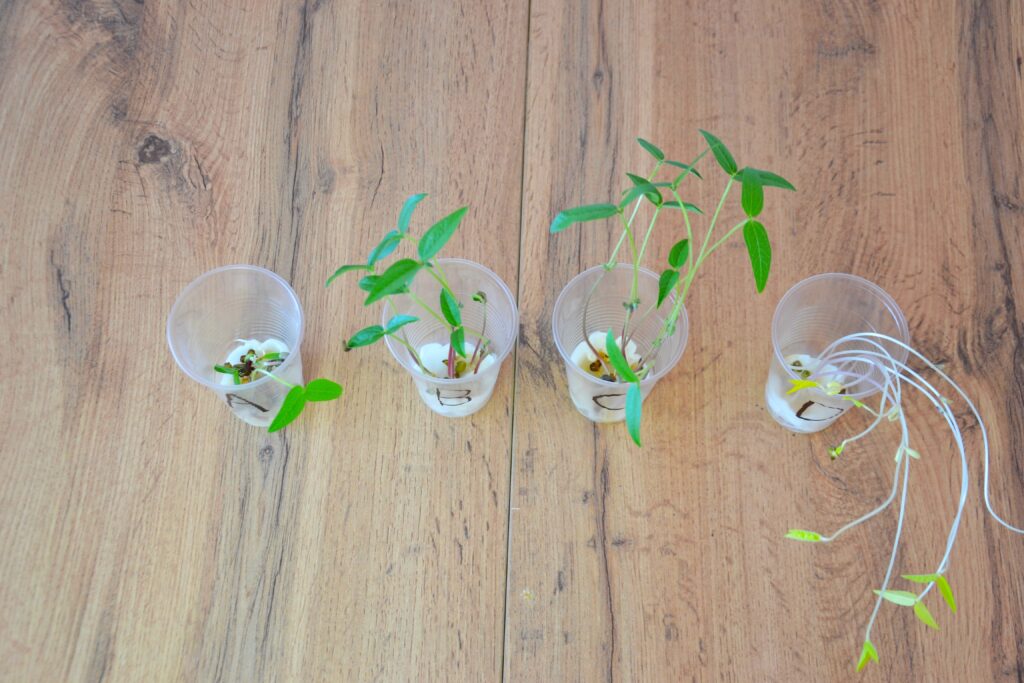
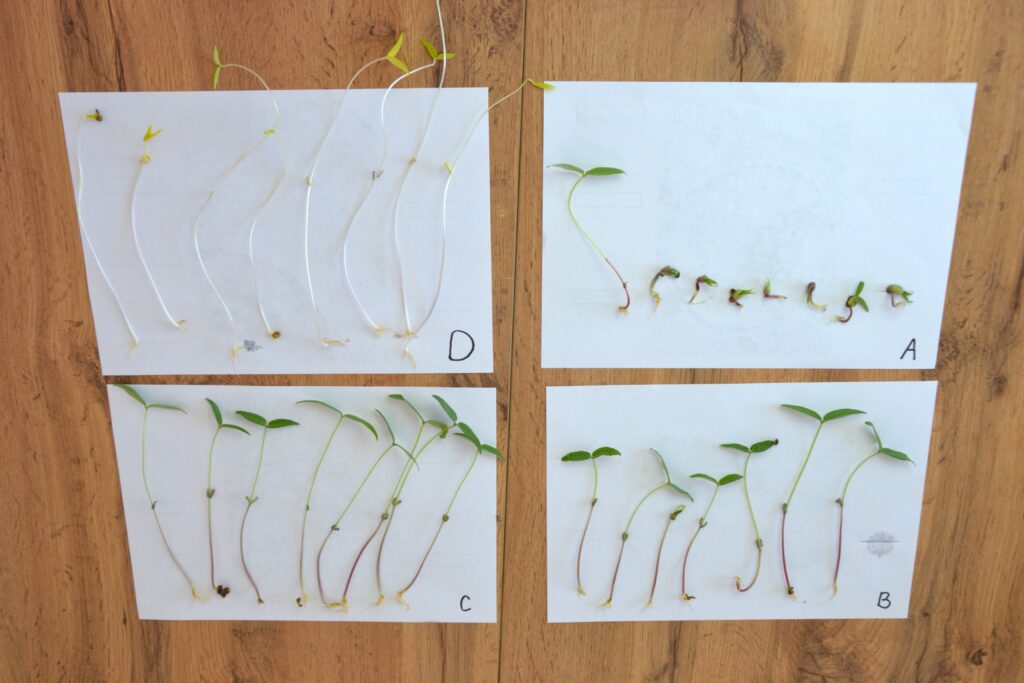
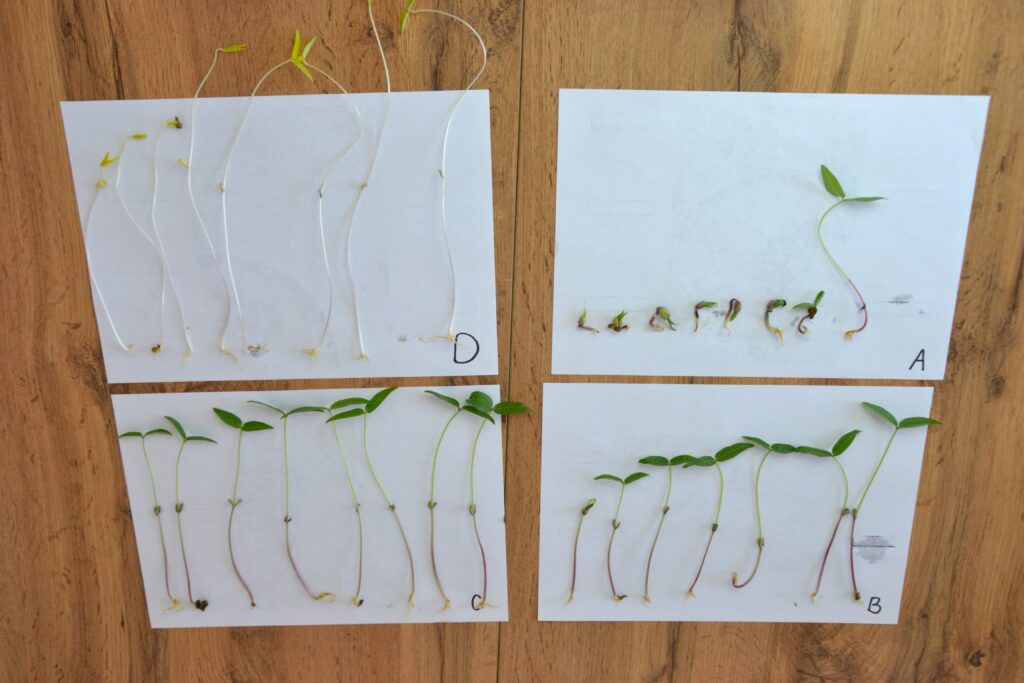
- Group A (natural light): poor seedling development was observed, with most seeds remaining at the root formation stage. A possible reason may be the influence of additional factors (e.g., moisture level, air movement, etc.).
- Group B (strong artificial light, 10–15 cm): seedlings were strong but somewhat shorter compared to Group C. Noticeable variability in stem length was observed. Leaves were well developed and dark green in color.
- Group C (weak artificial light, 30 cm): seedlings developed more uniformly in terms of stem length. Leaves were green and consistently colored.
- Group D (complete darkness): a pronounced etiolation effect was observed: leaves were pale yellow, stems were thin, whitish, and significantly longer compared to other groups.
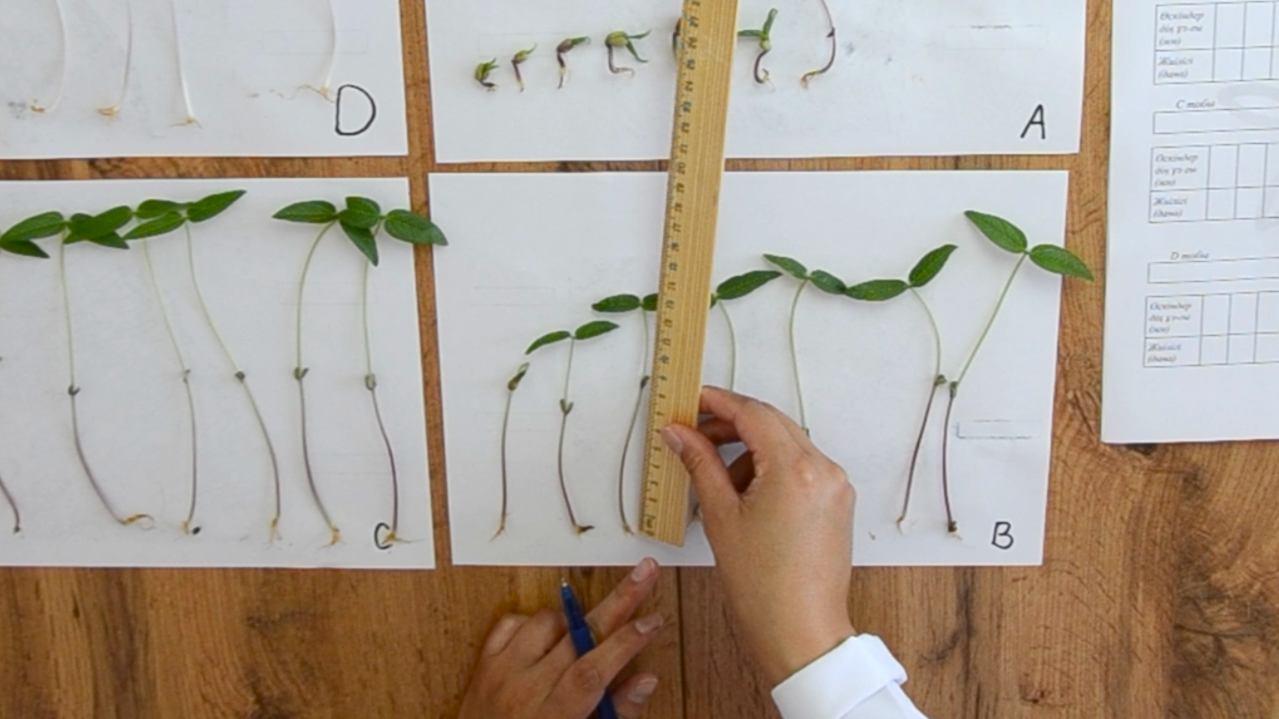
Step 2. Construct a variation series for each group. To do this, arrange the seedlings in order of increasing stem length.
Step 3. Measure the length of the hypocotyl of each seedling with a ruler and record the data in millimeters in the Worksheet.
The length of the hypocotyl is the distance from the point of attachment of the cotyledons to the beginning of the root system.
Step 4. Perform statistical processing of the data. For each variation series, calculate:
- Minimum value (min) — the smallest hypocotyl length;
- Maximum value (max) — the largest hypocotyl length;
- Mode — the value that occurs most frequently;
- Median — the value located in the middle of the ordered series;
- Mean value — calculated using the formula:
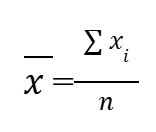
where x are the measured values of the trait, and n is the number of seedlings.

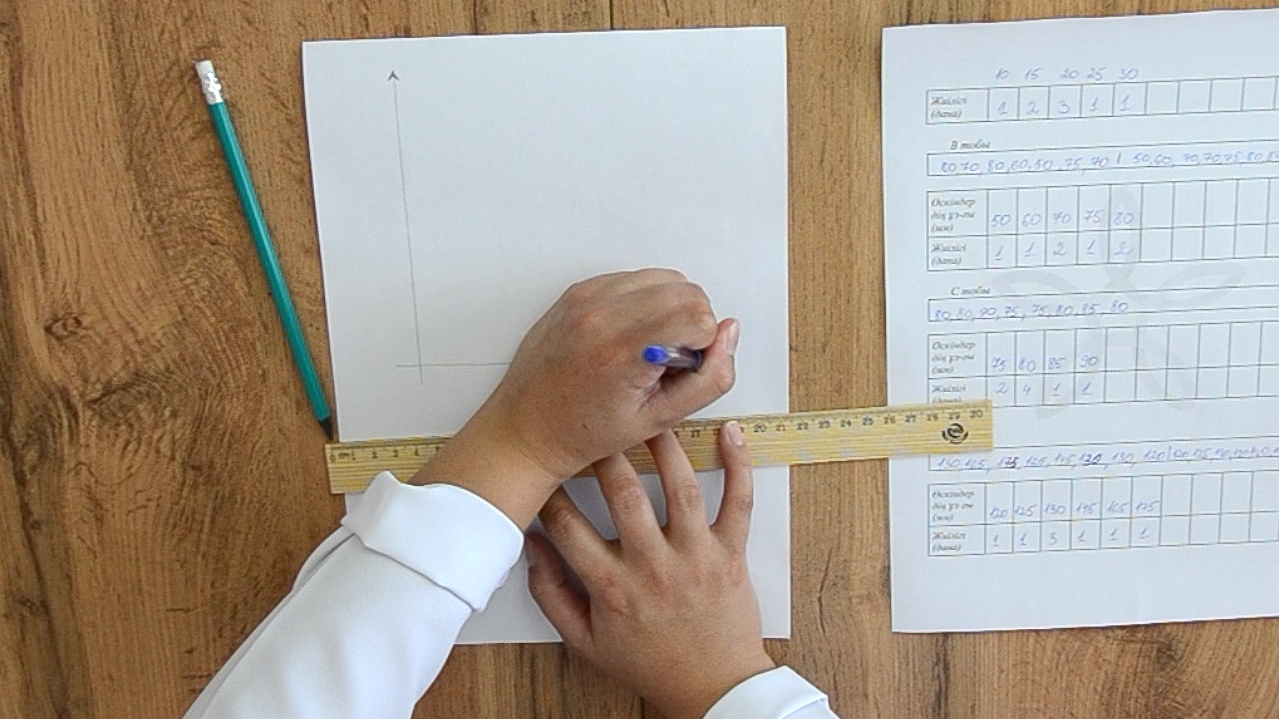
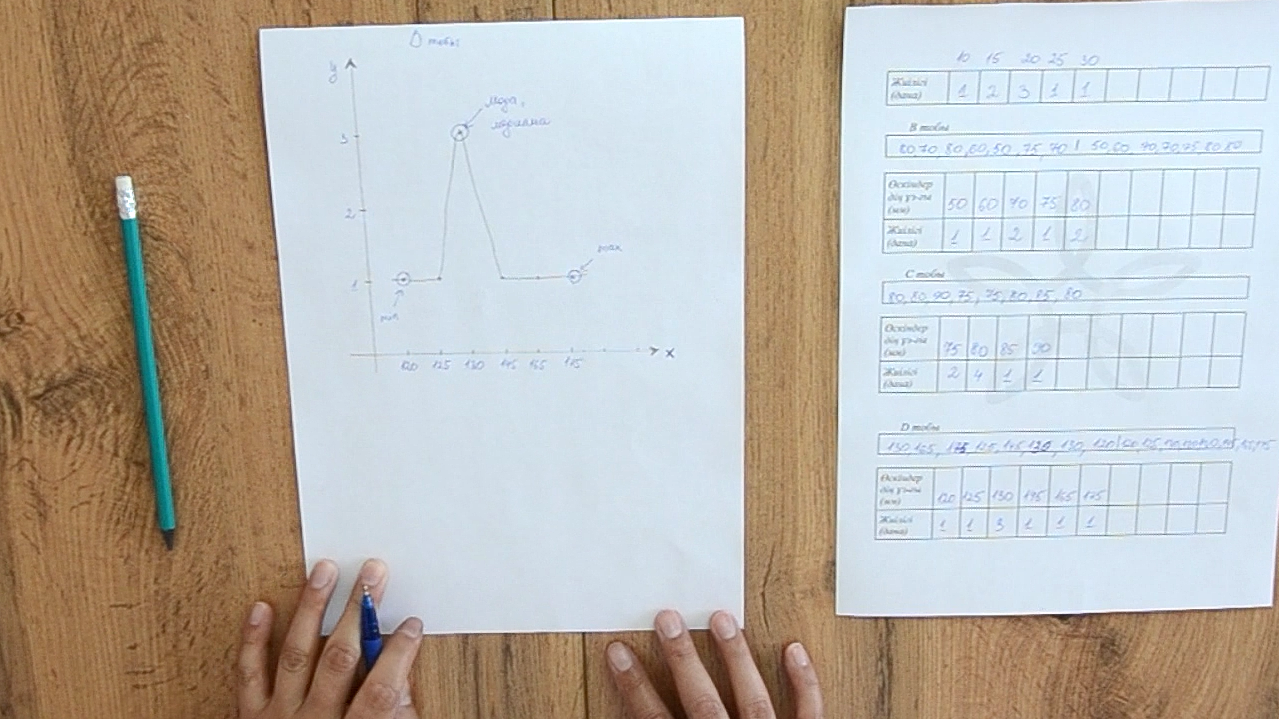
Step 5. Plot the variation series on a graph to obtain the variation curve.
- In the central part of the curve (the “peak”), the most frequently occurring values are found — the region of the mode and the median.
- At the edges, the extreme values are located (min and max).
- The shape of the curve reflects the patterns of modification variability and allows assessment of the influence of environmental factors on seedling development.
Conclusion
It was found that the growth of mung bean seedlings depends on environmental conditions. Measurements showed differences in stem length in seedlings of the same culture grown under different conditions. The variation series and curve clearly demonstrated that modificational variability has a mass and regular character.