
Binomial distribution: Plinko’s Game
Plinko Probability by PhET Interactive Simulations, University of Colorado Boulder, licensed under CC-BY-4.0 (https://phet.colorado.edu)
Objective:
- To know the definitions and formulas for calculating variance and standard deviation.
This virtual activity is designed to be used in the algebra lesson in the next chapter:
- Grade 8. “Mean. Dispersion. Standard deviation”.
Theoretical part
Plinko is a fascinating combination of chance and mechanics. A ball passing through many nails will eventually fall into one of the lower slots. It seems impossible to predict exactly where the ball will fall. However, the mathematical apparatus allows us to get closer to answering this question.
Average: This is the standard arithmetic mean. It shows what value our data is clustered around. In our game, this would be the average number of cells the ball passes through to the end.
Dispersion: This shows how much our data is scattered around the mean. A large variance means that the results are very different from each other.
Standard deviation: This is the square root of the variance. It tells us how much our data varies on average from the mean.
Binomial Distribution: This is a probability distribution that describes the number of successes in a sequence of independent trials, each with only two possible outcomes (e.g., the ball deflects left or right). In our Plinko game, we can use the binomial distribution to model the process of dropping the ball.
Binomial distribution formula:
- N – the total number of trials.
- x – arithmetic mean
- s – standard deviation (actual)
- smean – coefficient of variation
- 𝝻 (mu) – population average
- 𝞂 (sigma) – standard deviation (theoretical)
- xᵢ – value of each individual data item
- Σ – sign of summation
x=(x1+x2+…+xn)/n
σ = √[ Σ(xᵢ – x̄)² / (n – 1) ]
μ = (Σx) / N
smean=s / μ
Virtual Experiment
The main purpose of our work is to experimentally confirm the theoretical knowledge about mean, variance and standard deviation using the example of the Plinko game in the Phet simulation. In this work, students can predict which basket the ball will fall into and compare several trials. They can further explore binary probability using the parameters on the board.
Workflow:
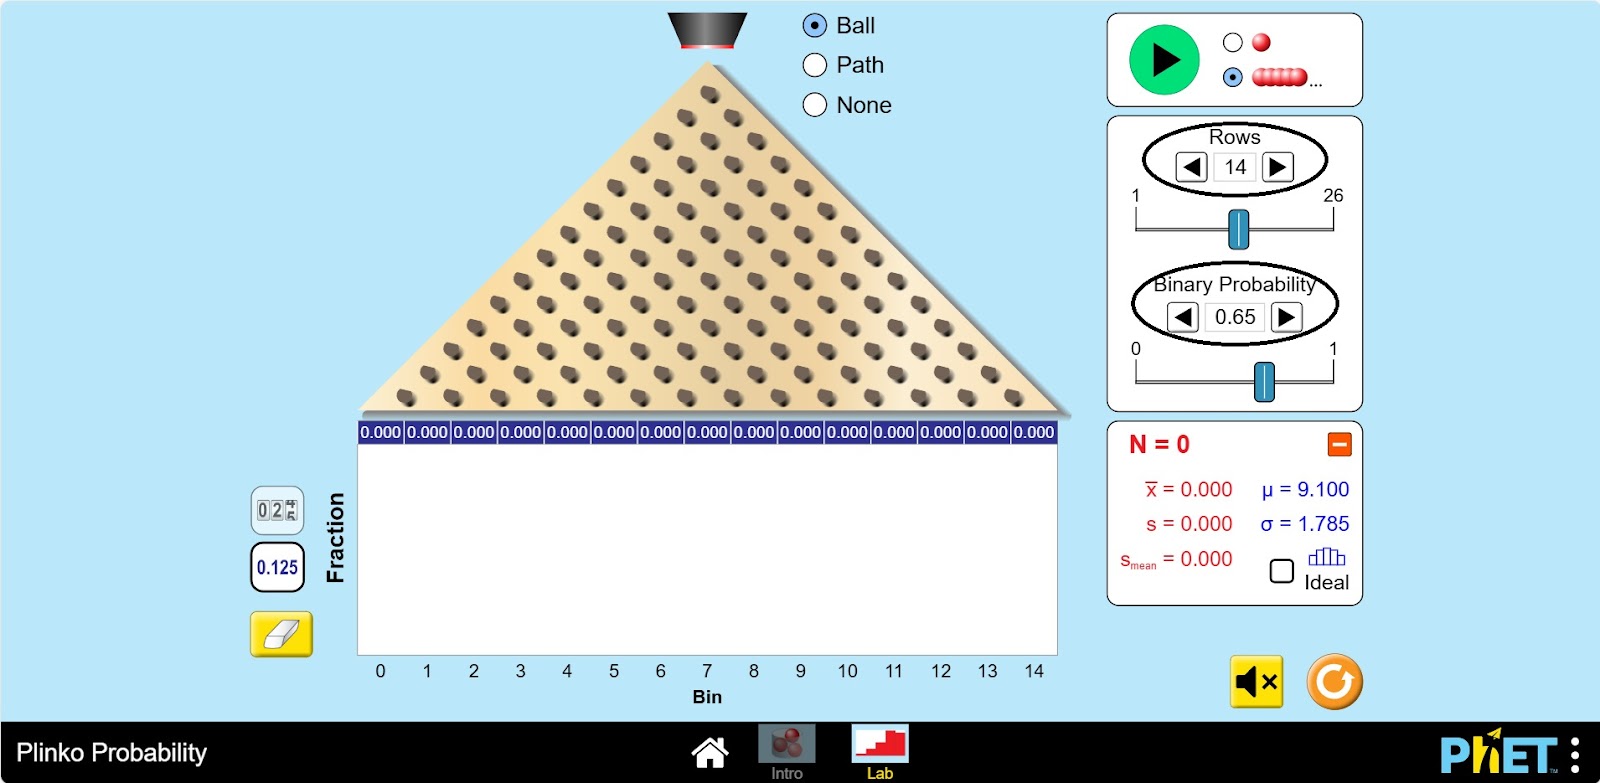
Step 1. You will be given 2 different modes, “Intro” and “Lab”. Open the “Lab” section.
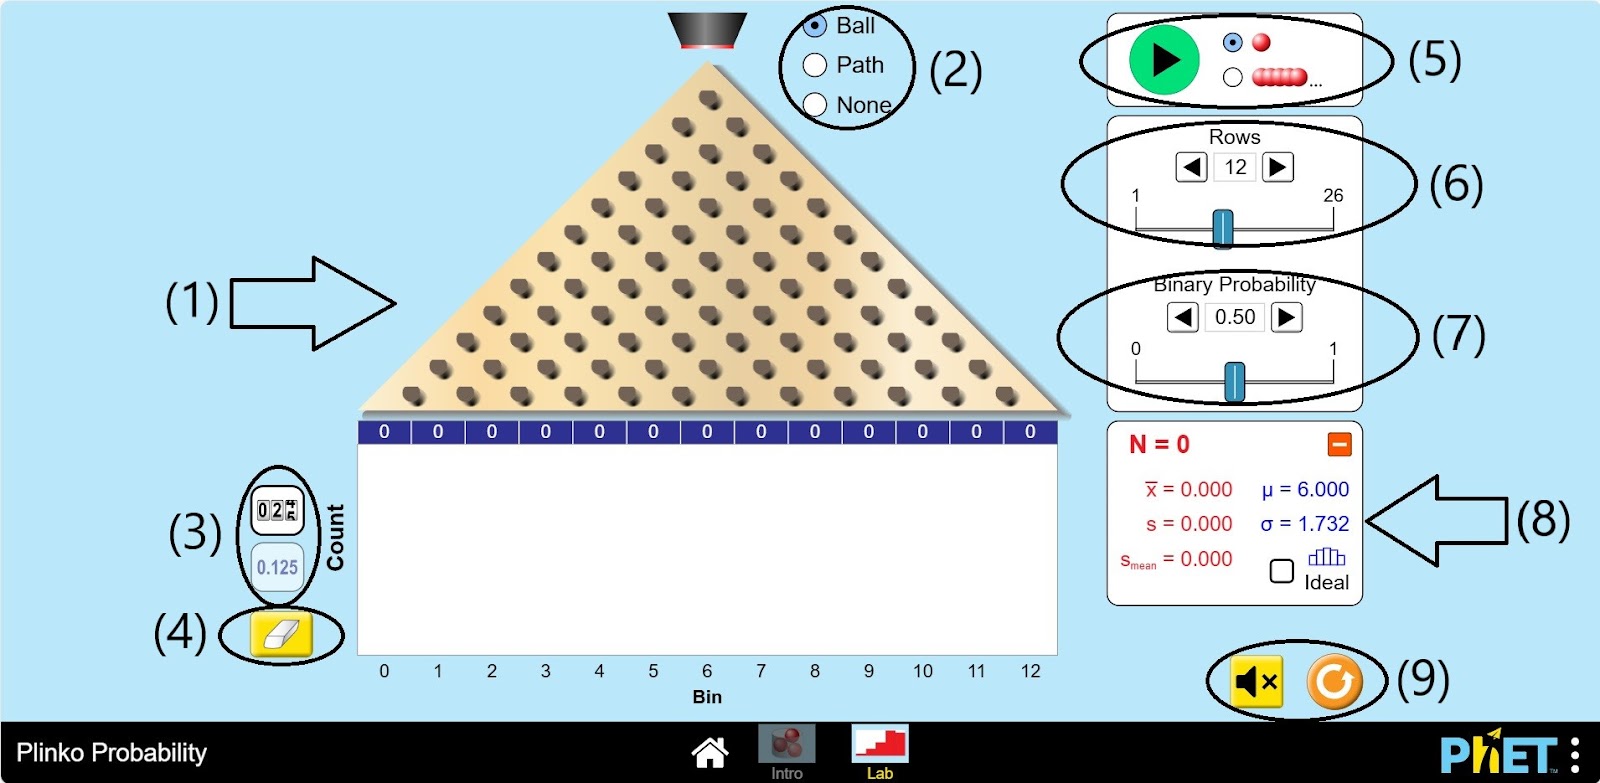
Step 2. In the workspace you are provided with
- Plinko game (1);
- Buttons to indicate the type of ball falling into the cells: ball, path, nothing (2);
- Buttons to display the number of balls in the cells or to display it as a fraction (3);
- Eraser (4);
- Plinko game start panel: regular or continuous ball release (5);
- Button to set the number of rows in the Plinko game: from 1 to 26 (6);
- Button for binary probability: interval 0-1 (7);
- Statistical data: part of the sample of balls – red color, all data of balls – blue color (8);
- Voice control and restart buttons (9).
Step 3. Switch the ball flow to continuous.

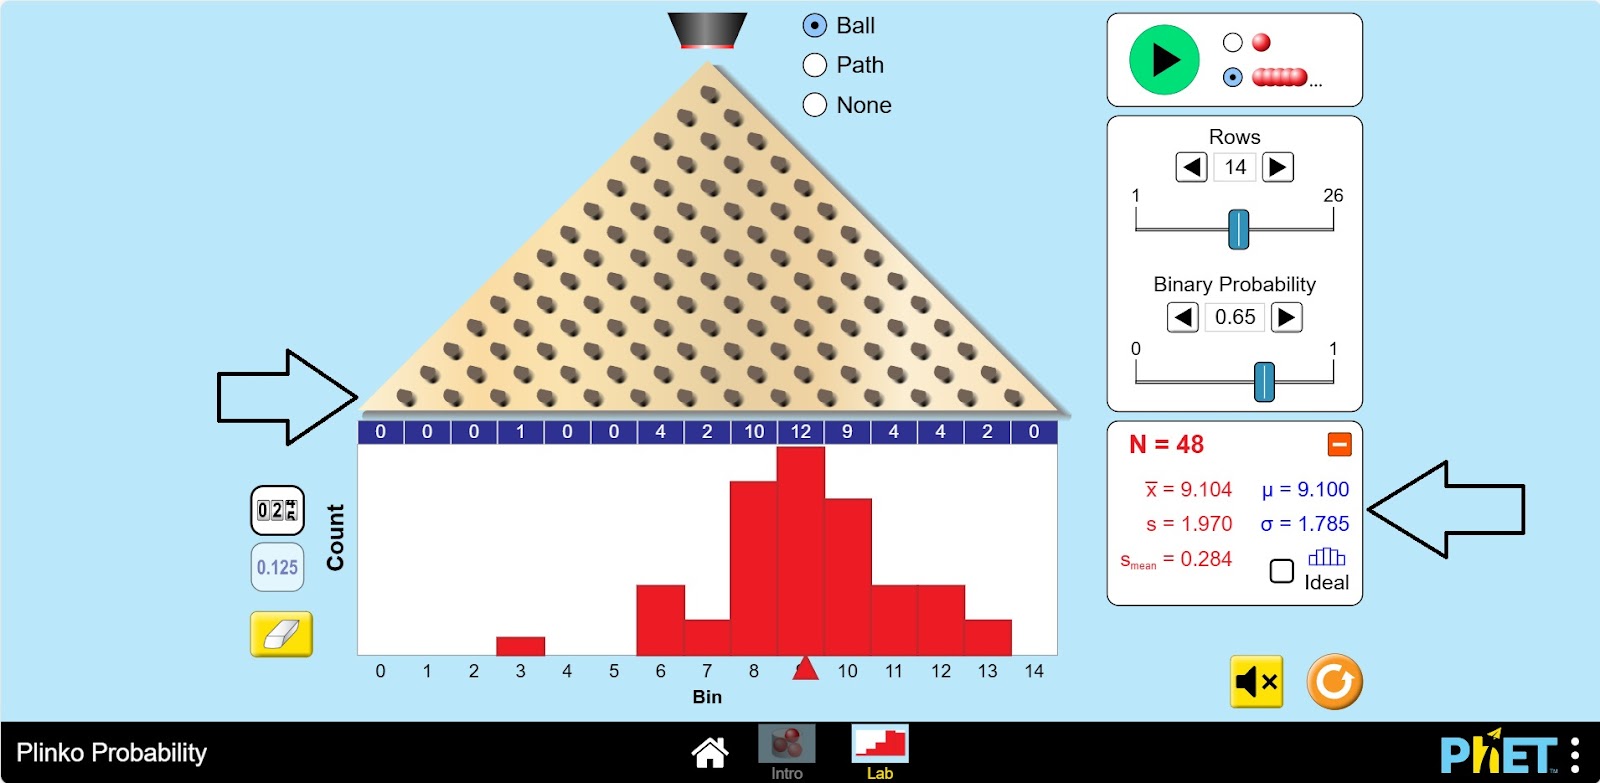
Step 4. Start the game. Stop when the balls reach a certain number.
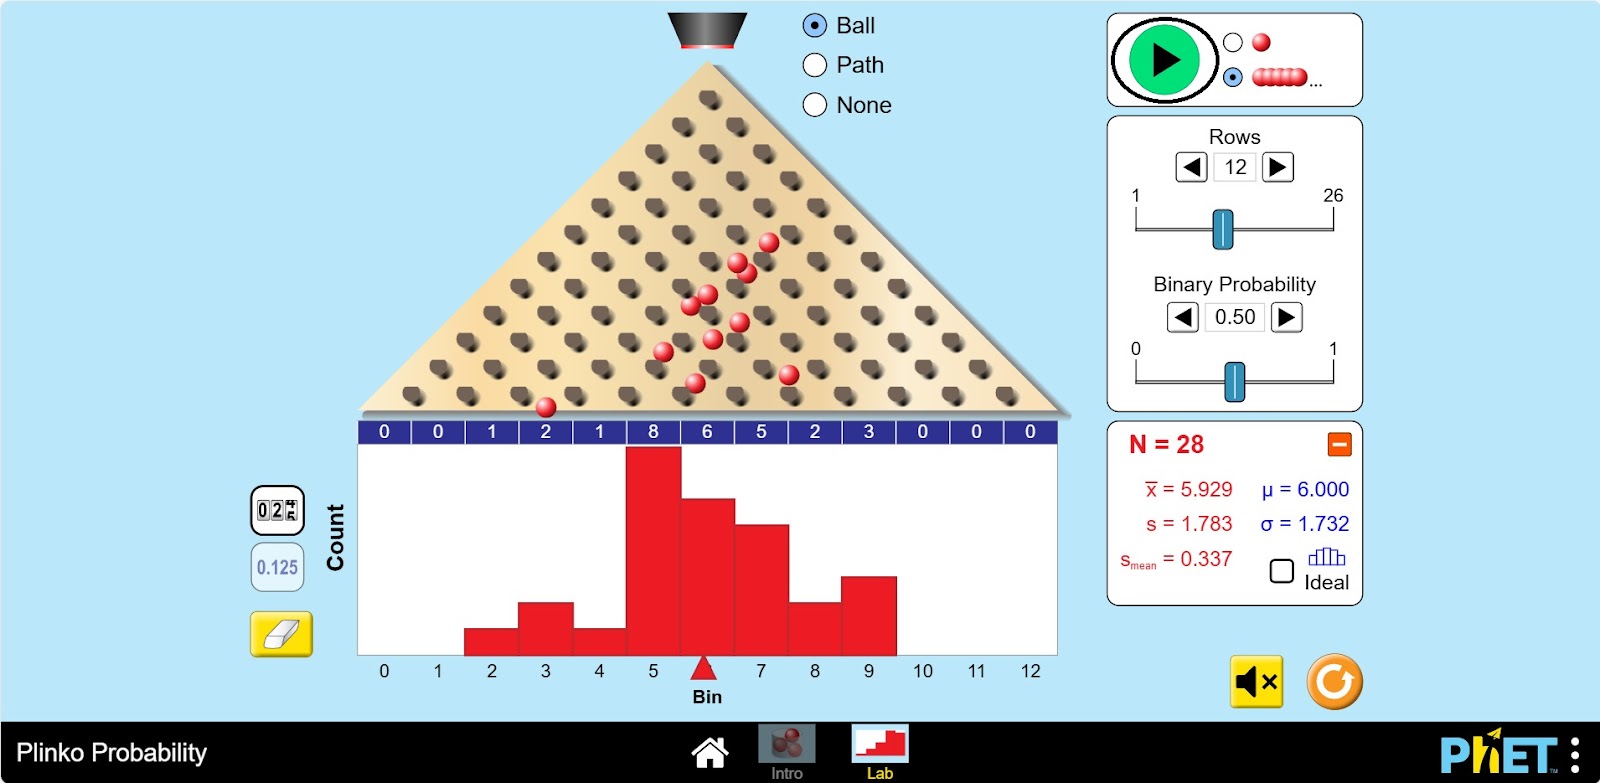
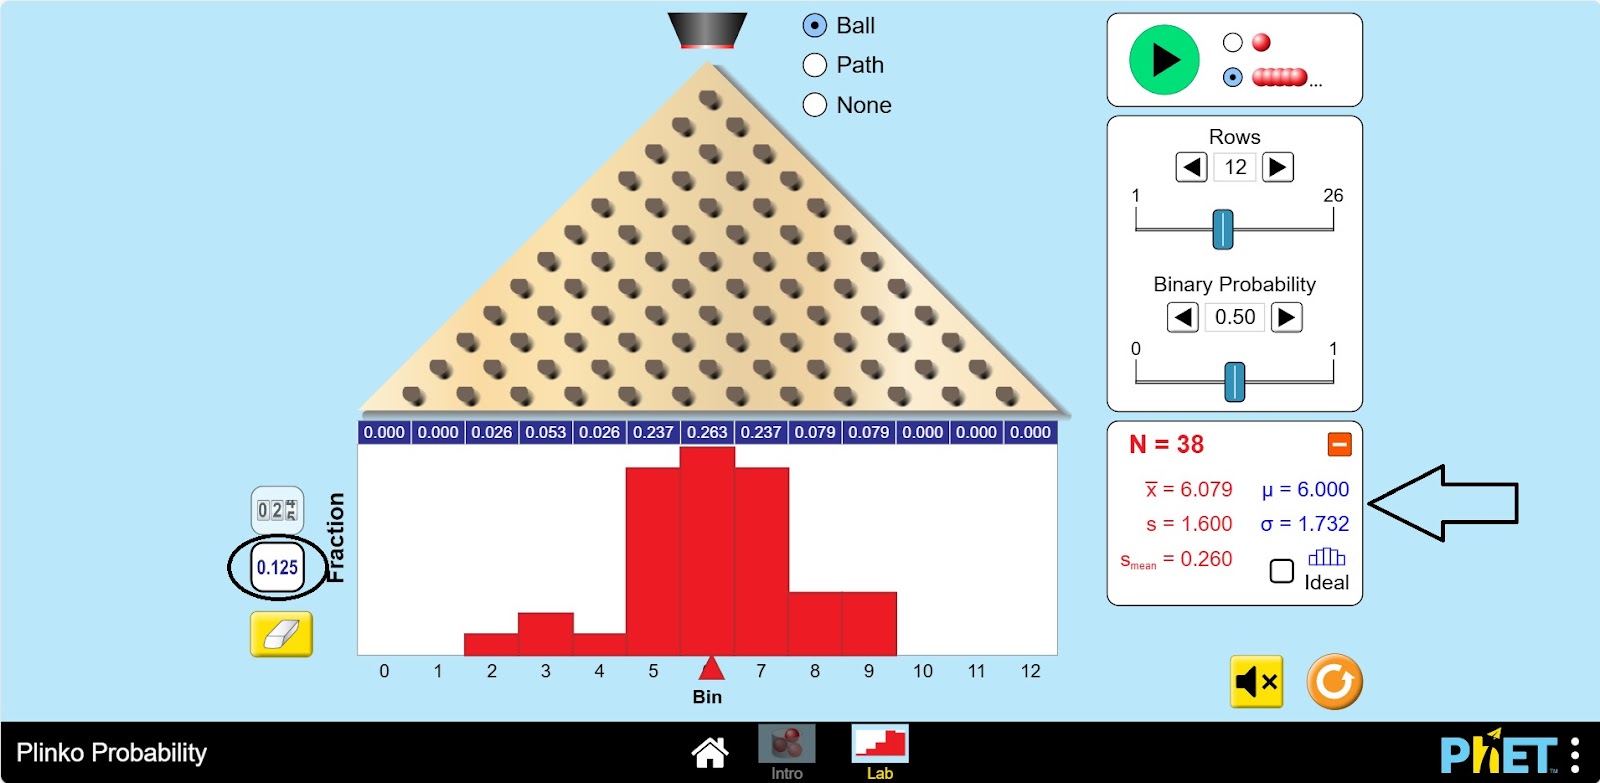
Step 5. Examine the data. See the mean, standard deviation values, arithmetic mean. How to be in perfect condition. Try converting the number of balls in the cells to a fractional type.
Step 6. Change the number of rows, binary probability.
Step 7. Restart the game. Examine the data. Compare the results of the game with the previous probability distributions.
Conclusion
The use of the simulator allowed us to visualize the relationship between probability theory and concrete experiments. The theoretical ideal calculated the mean and compared the standard deviation that we get from several experiments on the simulator. We verified that the results depend on changing the game settings.