
Lesson 1
Topic: The study of cooling process
Purpose of the laboratory work:
Students should understand the principle of changing the temprature of substances
Students should understand the mechanism of changing aggregate states
Teacher’s guide:
Tasks are performed in groups of 3-4 people
Working with an electric stove requires increased attention
The ice should be as fresh as possible
Learning outcomes:
Students understand how aggregate states are changing
Students are able to draw a reverse cooling schedule
Theory
A cooling curve depicts how the temperature of a substance changes as it cools down while maintaining constant pressure. To illustrate this process, we’ll focus on the cooling and crystallization of water.
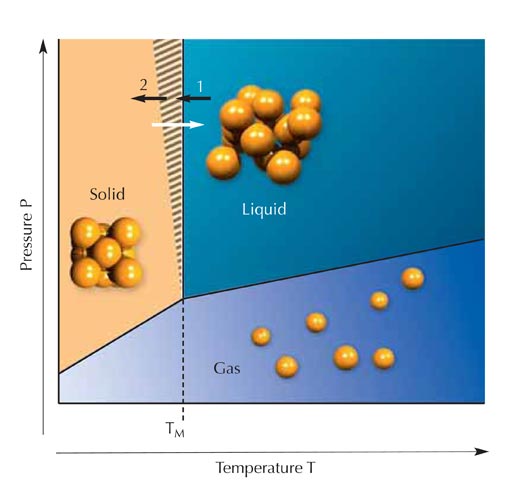
1. Initial High Temperature: Initially, the water is at a high temperature, often in its liquid form. As heat is removed from the system, the temperature of the water starts to decrease. The cooling curve begins with a steep downward slope.
2. Supercooling: In some cases, water can remain in its liquid state even though it has cooled below its normal freezing point. This phenomenon is known as supercooling. The temperature continues to drop, but the water remains in a liquid state because there are no nucleation sites for ice crystal formation.

3. Freezing: The most significant feature of the cooling curve is the abrupt temperature drop as the water undergoes the phase transition from a liquid to a solid. This transition represents the formation of ice crystals as the water molecules slow down and arrange themselves into a crystalline structure. During this phase transition, latent heat is released, which keeps the temperature constant until the crystallization process is complete.
4. Plateau: The plateau on the cooling curve corresponds to the period when the water is actively crystallizing into ice. While the phase transition occurs, the temperature remains constant. Once the water has fully crystallized into ice, the temperature starts to decrease again.
5. Steady Decline: After the phase transition is complete, the temperature continues to decrease steadily as the ice cools down further. The rate of cooling depends on factors like the thermal conductivity of ice and the temperature of the surroundings.
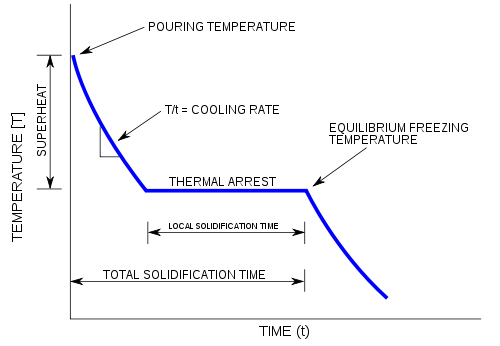
Understanding the cooling curve and the process of crystallization is fundamental in numerous applications, such as ice formation in refrigeration, the production of high-quality crystalline materials in industries like pharmaceuticals and semiconductors, and even the study of natural phenomena like the formation of snowflakes and ice crystals in the atmosphere. The plateau in the cooling curve, where heat is released during crystallization, is a critical feature that distinguishes this process from simple cooling.
Materials
- Plastic cups
- Thermometer
- Ice
- Water
- Stopwatch
- A pen
- Paper
Practical part
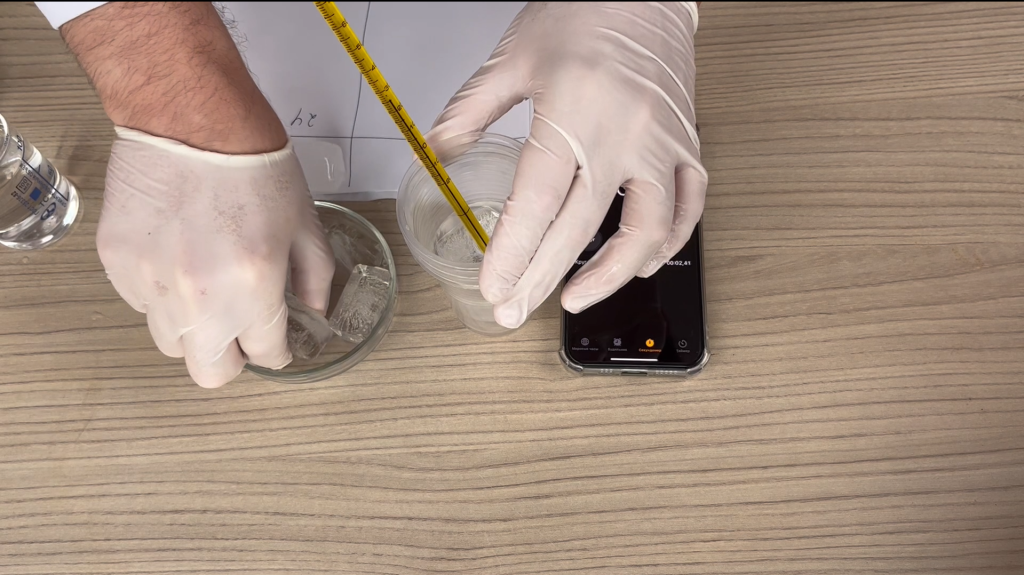
To start, put 30-40 ml of water in a plastic cup.
Put the thermometer in the water. Wait 30 seconds and record the temperature.
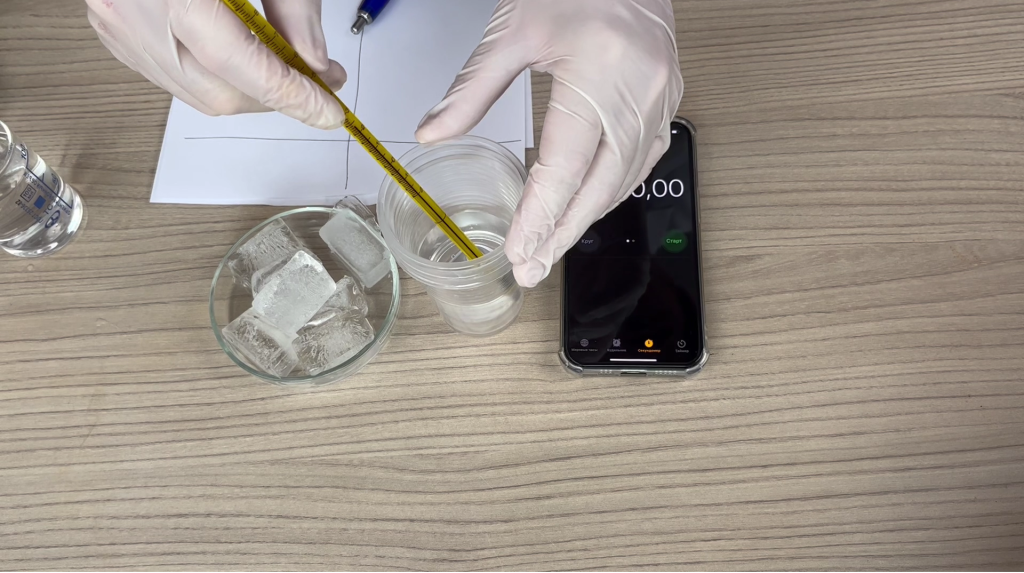
Pour ice into the water and start the timer.
Record the temperature every 30 seconds.
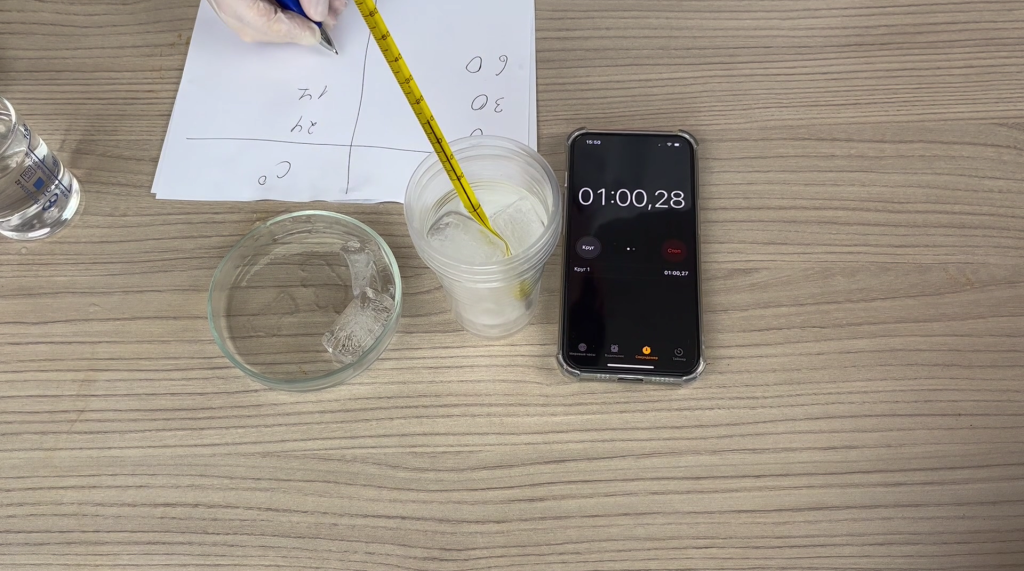
As soon as the temperature reaches 0-1 degrees Celsius, record observations for another 2-3 minutes.
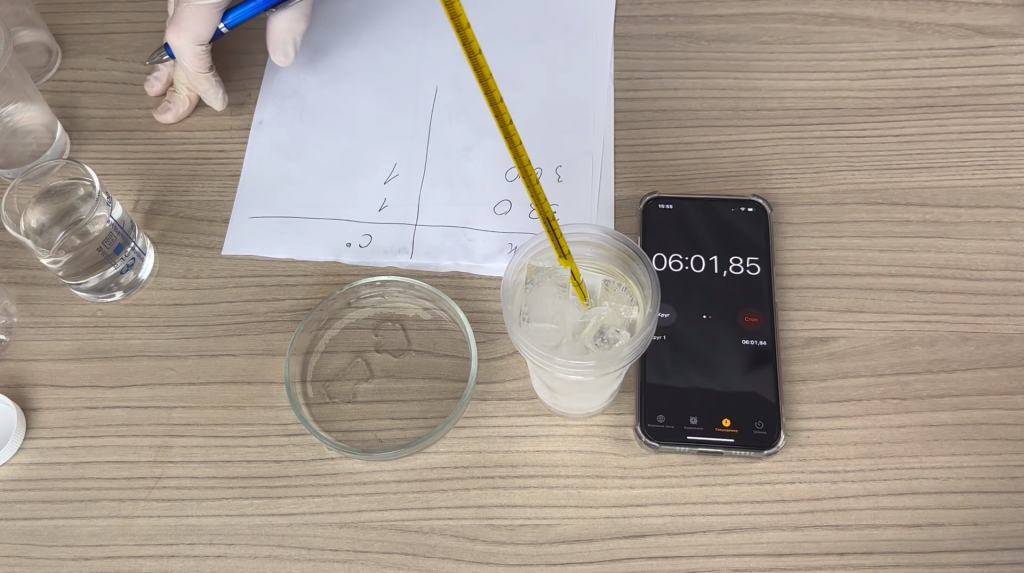
Plot the temperature versus time dependence in the worksheet
Rules for designing the laboratory work
The laboratory work should contain items in the following order:
- Laboratory work number
- Topic name
- Purpose of the work
- Hypothesis
- Brief description of the theoretical part
- Equipment
- Steps in the correct sequence
- Add a photo from the experiment (if you can’t insert a photo, you can add a picture)
- Give a brief description
- Write a brief discussion and explanation of the topic covered
- Write the conclusion of the work
- The workplace must be cleaned and put in order
Worksheet
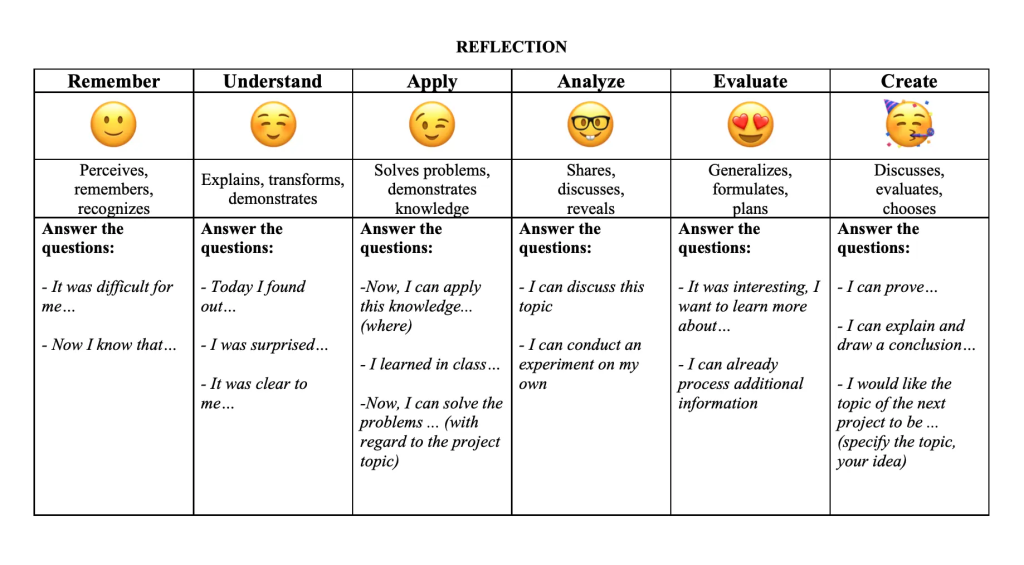
Feedback
Safety technique