
Direct Proportionality and its Graph
Unit Rates by PhET Interactive Simulations, University of Colorado Boulder, licensed under CC-BY-4.0 (https://phet.colorado.edu)
Objective:
- To recognize direct proportional relationships;
- Know the formula and construct a graph of direct proportionality;
- Analyze graphs of true relationships between directly proportional quantities;
- Write the formula for direct proportionality by description.
This virtual activity is designed to be used in the math lessons in the next chapter:
Grade 6. “Dependence between quantities”
Theoretical part
Direct proportionality is a relationship between two quantities in which an increase in one quantity by a factor of several leads to an increase in the other quantity by the same factor. In other words, the ratio of these quantities always remains constant.
Example: Speed and distance traveled: The faster you go, the farther you go in the same amount of time.
Direct Proportionality Formula
y = kx, where:
y and x are two directly proportional quantities,
k is the coefficient of proportionality, which indicates how many times y increases when x is increased by 1.
Virtual Experiment
In this simulation, students create reports about the relationship between quantities. The Racing Lab screen allows students to compare speeds on a racetrack. Students can examine roads of different lengths and cars of different speeds. Identifies the unit rate and how it is calculated. Develop strategies for using unit rate to solve problems.
Workflow:
Step 1. You will be given 3 different modes, “Shopping”, “Shopping Lab” and “Racing Lab”. In this activity you will work in the “Racing Lab” section. Open the “Racing Lab” section.
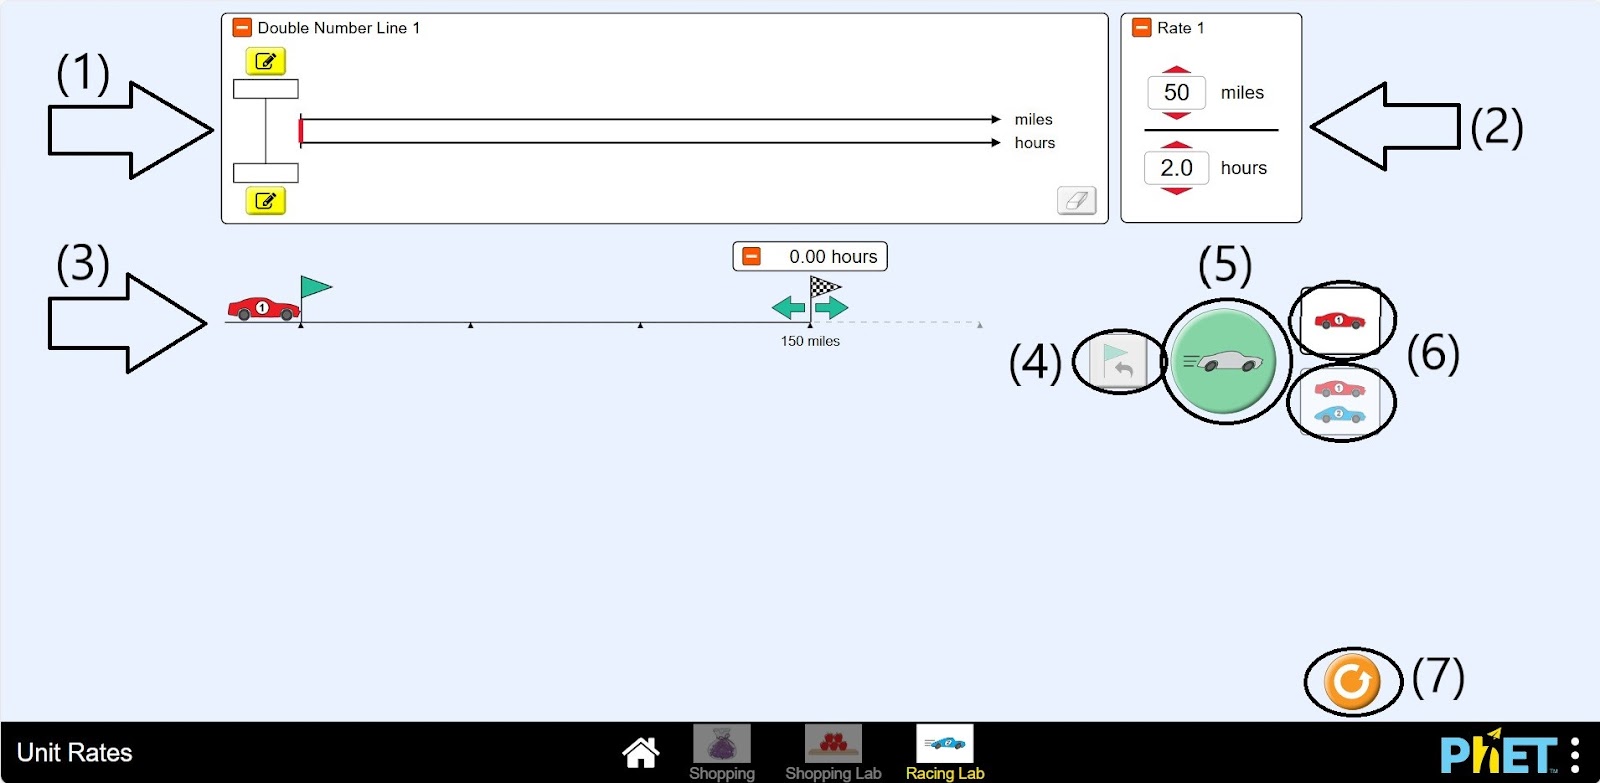
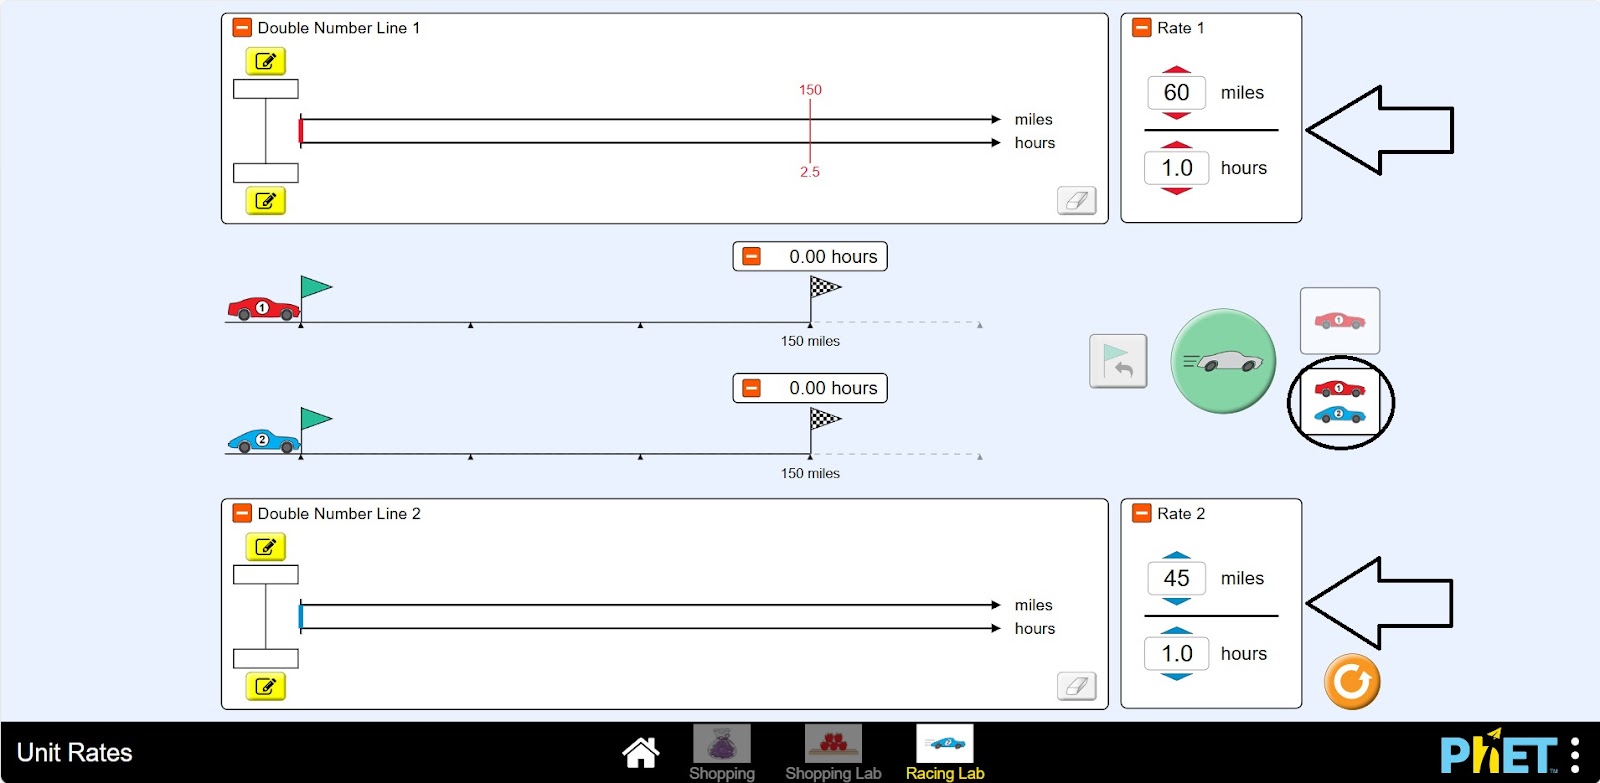
Step 2. In the workspace, you will find
- A double digital scale (1);
- The speed sign of the car (2);
- Car and road (3);
- Return to start button (4);
- Button for driving the machine (5);
- Button to display two roads and machine on the screen (6);
- Restart button (7).
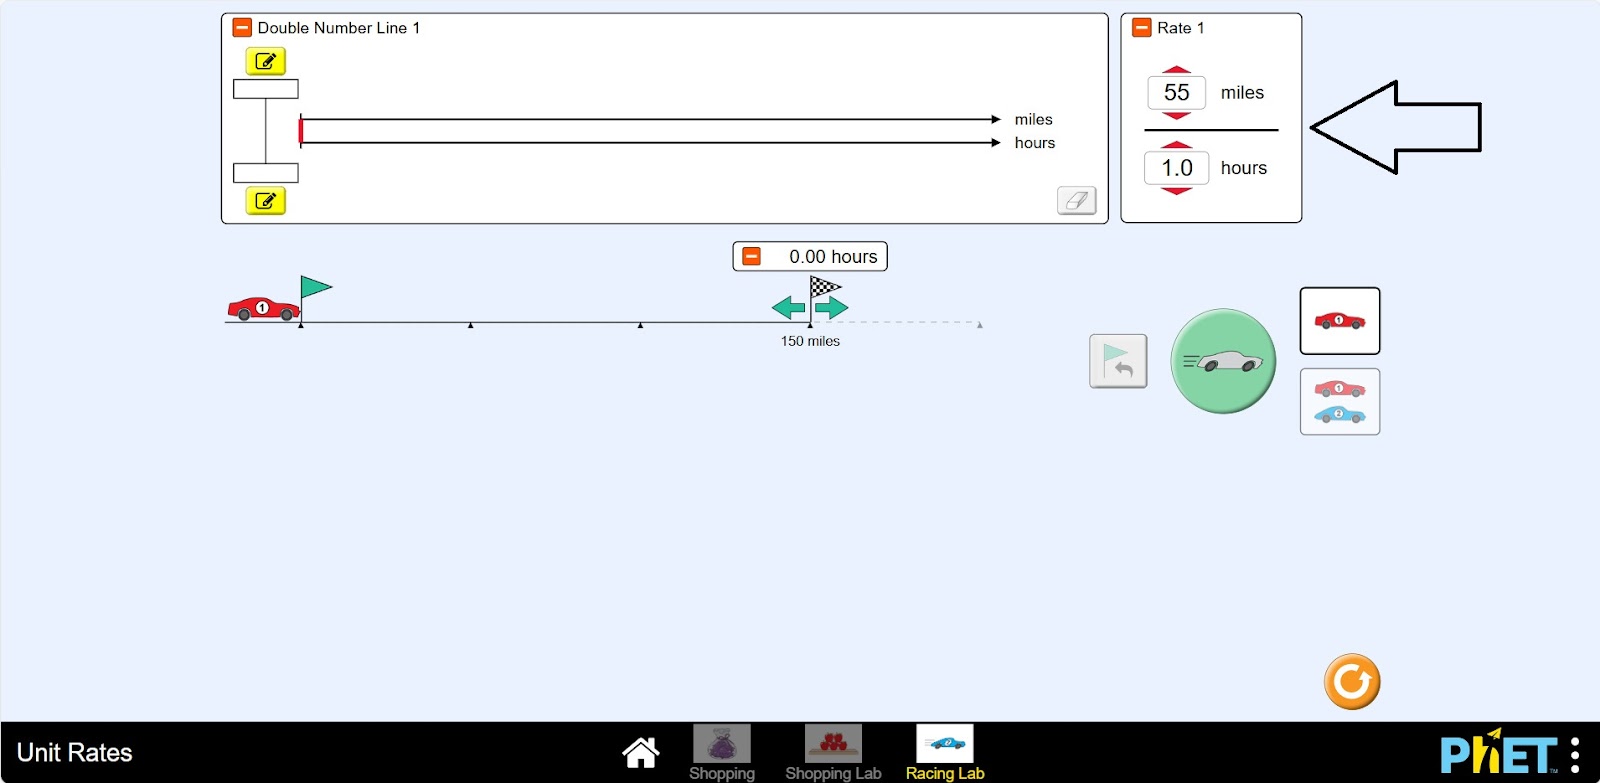
Step 3. Set the speed of the car.
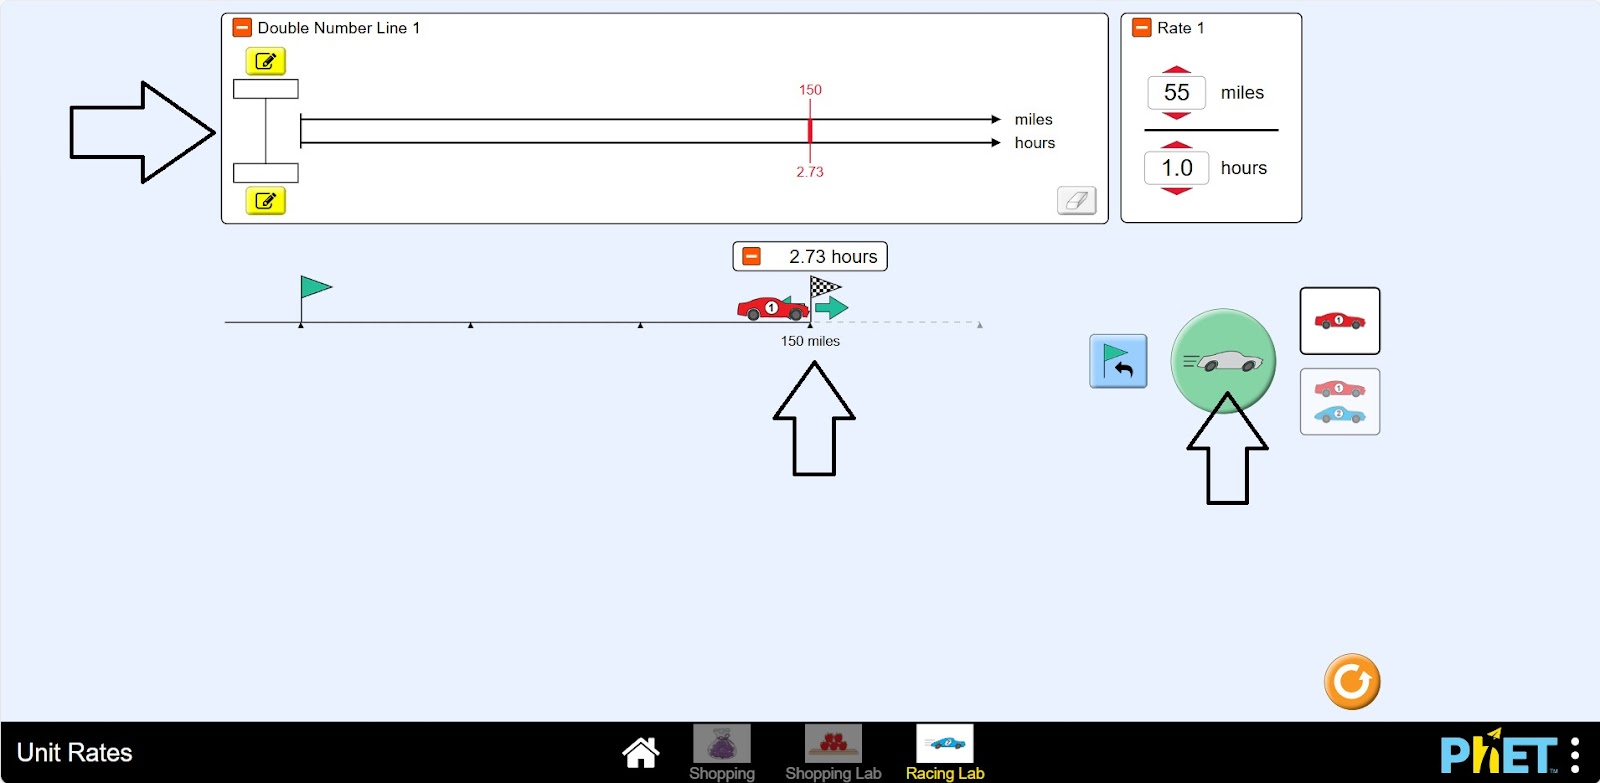
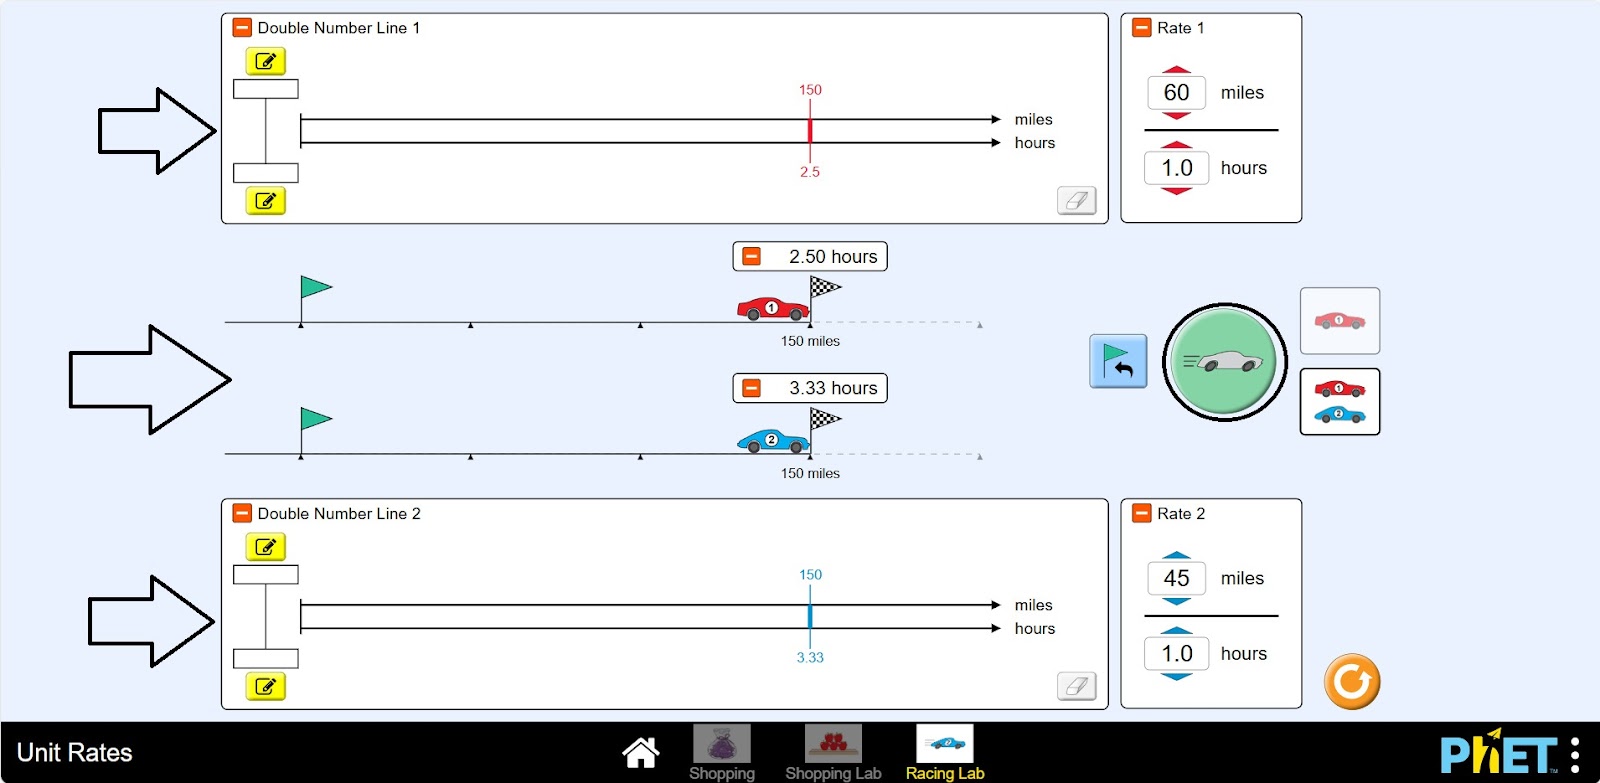
Step 4. Drive the car. Check the data.
Step 5. Press the button to output two roads and cars to the screen. Give the cars different speeds. Make the finish point the same for both cars.
Step 6. Drive the cars. Examine the data.
Step 7. Do some more experiments and run the study.
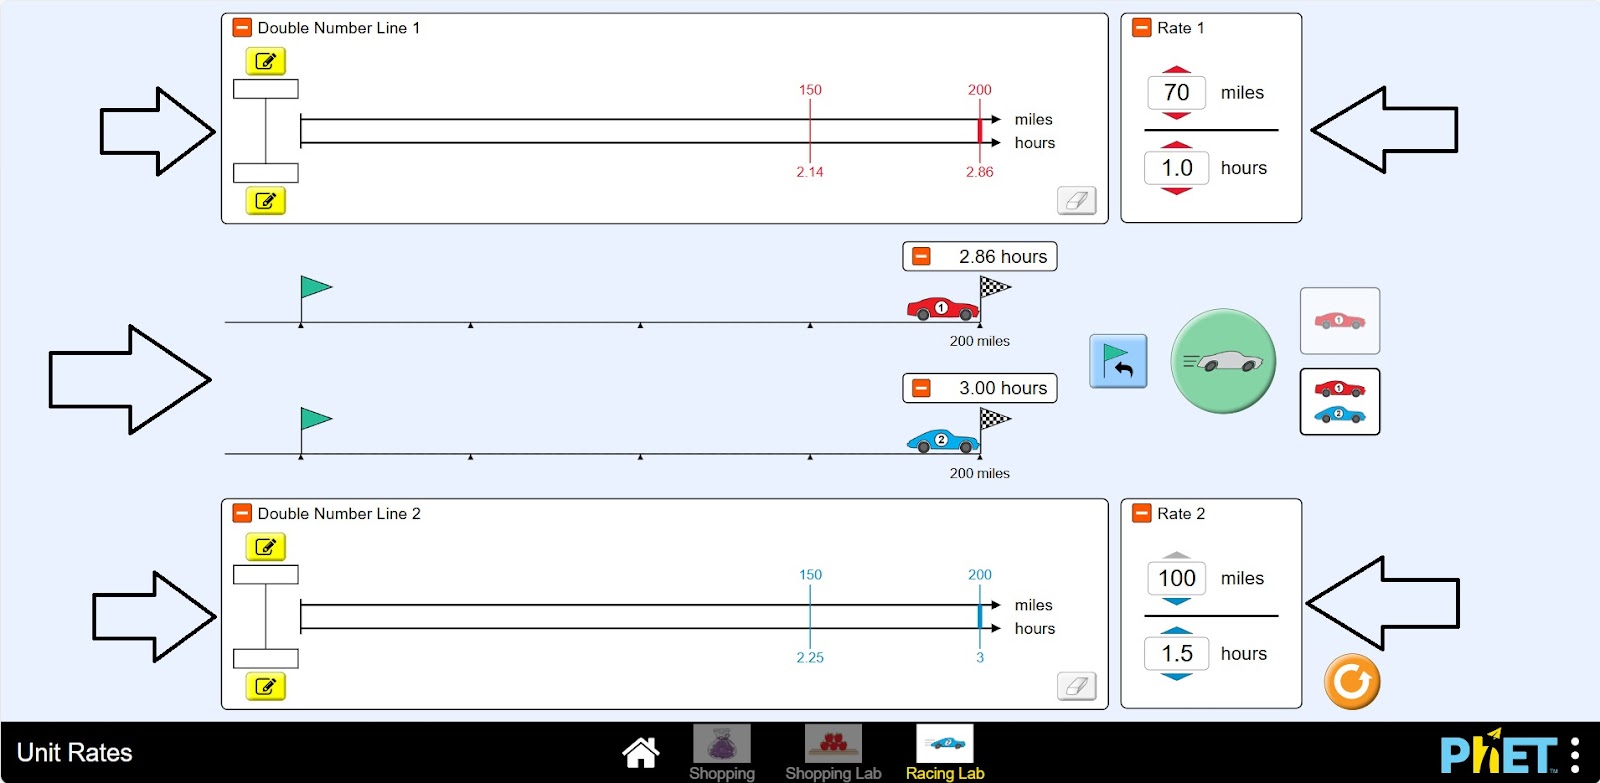
Conclusion
In this activity, students solved problems about the relationship between quantities. They found the relationship between speed, distance, and time. They compared these quantities for two simultaneous cases.