
Ion ratio of acidic and basic solutions
pH Scale by PhET Interactive Simulations, University of Colorado Boulder, licensed under CC-BY-4.0 (https://phet.colorado.edu)
The title of the Project: Ion ratio of acidic and basic solutions
This virtual laboratory is intended for use in chemistry classes on the following topics:
- 11th grade. Chapter X. “Acidic and basic solutions”.
Objectives:
- Familiarize students with the concept of pH and its relation to the concentration of ions in a solution.
- Allow students to explore the pH of everyday liquids through a virtual simulation.
- Provide a visual representation of how pH relates to the concentration of hydronium and hydroxide ions at the molecular level.
Practical part

This simulation helps you understand the pH of everyday liquids and how it relates to the concentration of ions at the molecular level.
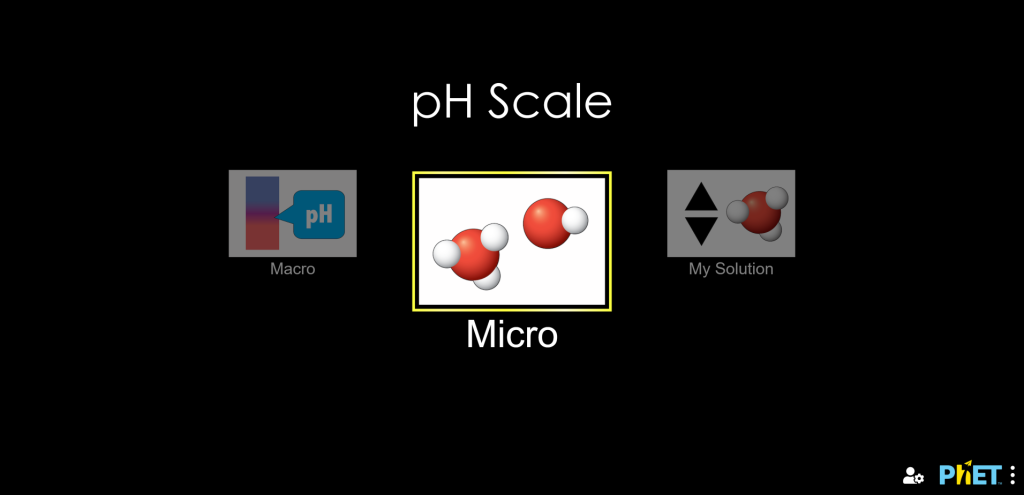
Step 1. The simulation has three screens: “Macro,” “Micro,” and “My solution.” Click on Micro to explore the relationship between pH and ions.
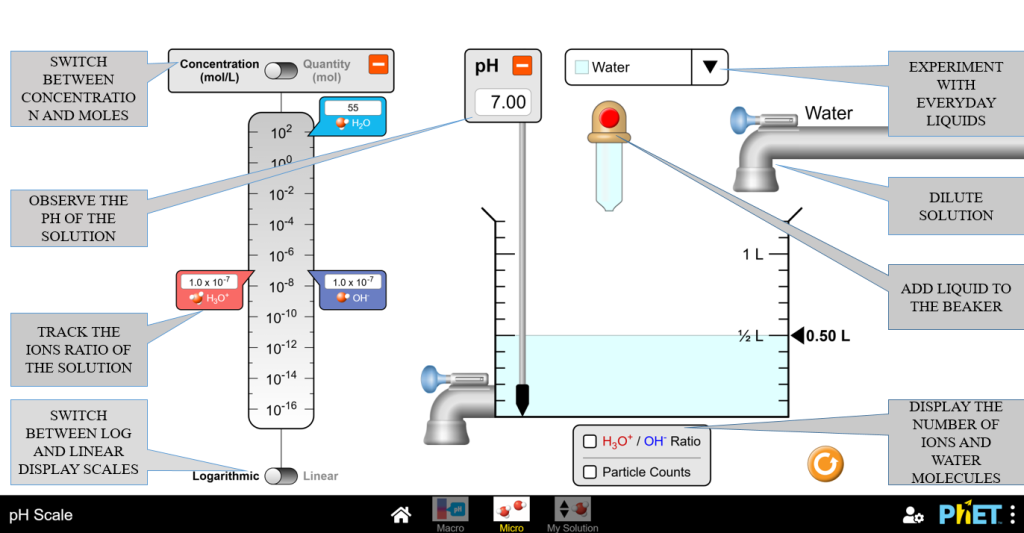
Step 2. You’ll see a beaker, a list of solutions in a dropdown menu, a pH probe in the solution and water taps on the right.
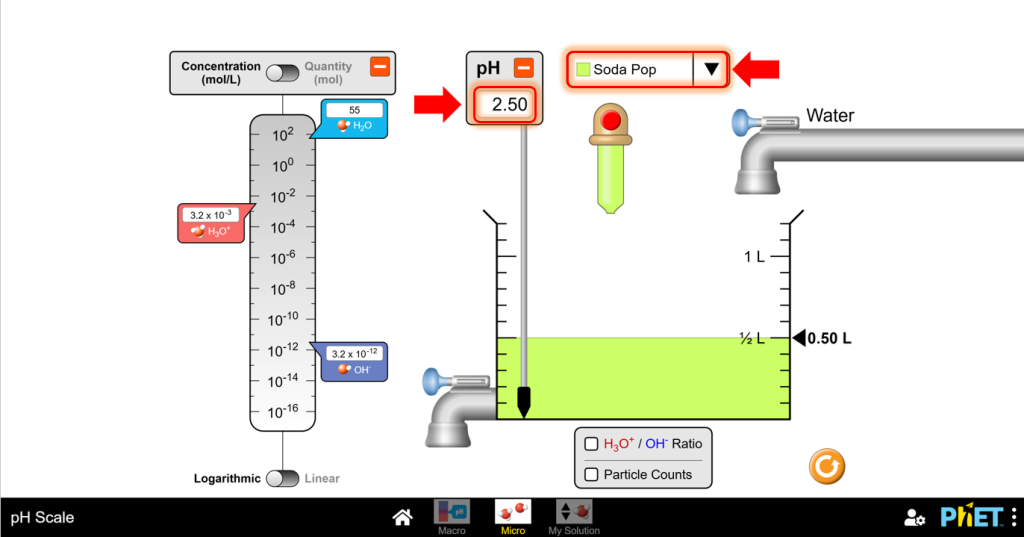
Step 3. Select a solution from the available options. Let’s try soda pop. You’ll see from the scale that soda pop is acidic (around pH 2.5).
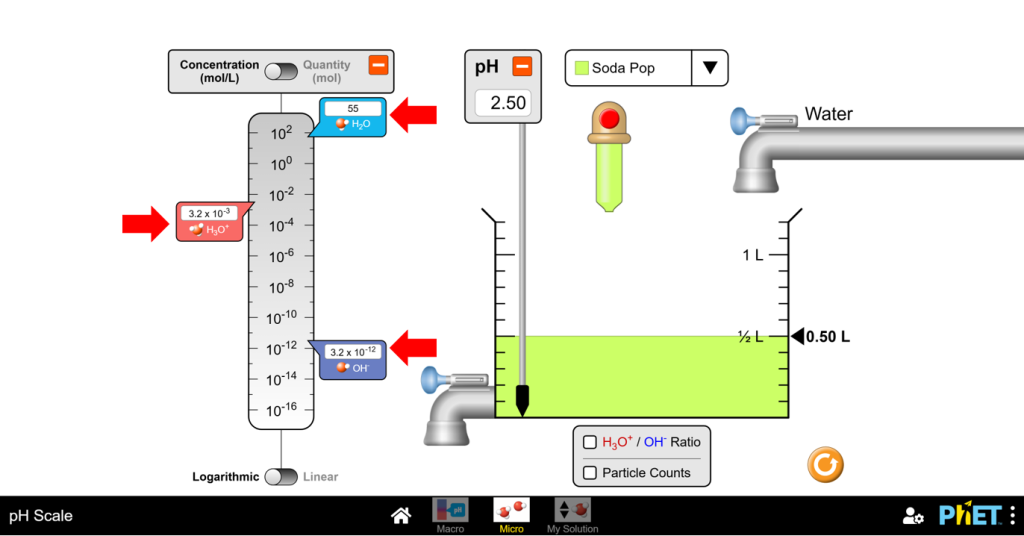
Step 4. Observe the graph or scale on the left. It shows the concentration (in moles) of:
- Hydronium ions (H₃O+) – associated with acids (higher concentration expected)
- Hydroxide ions (OH⁻) – associated with bases (lower concentration expected)
- Water (H₂O)
Step 5. Notice the default logarithmic scale. This emphasizes the vast difference between hydronium and hydroxide concentrations.If unfamiliar with scientific notation, switch the graph to a linear scale. This visually emphasizes the magnitude of the difference between ion concentrations.
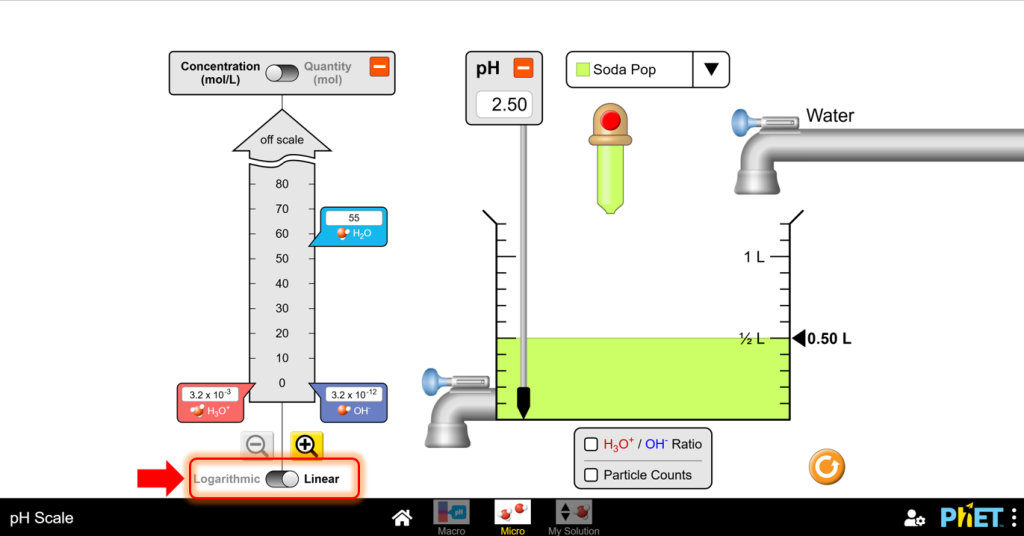
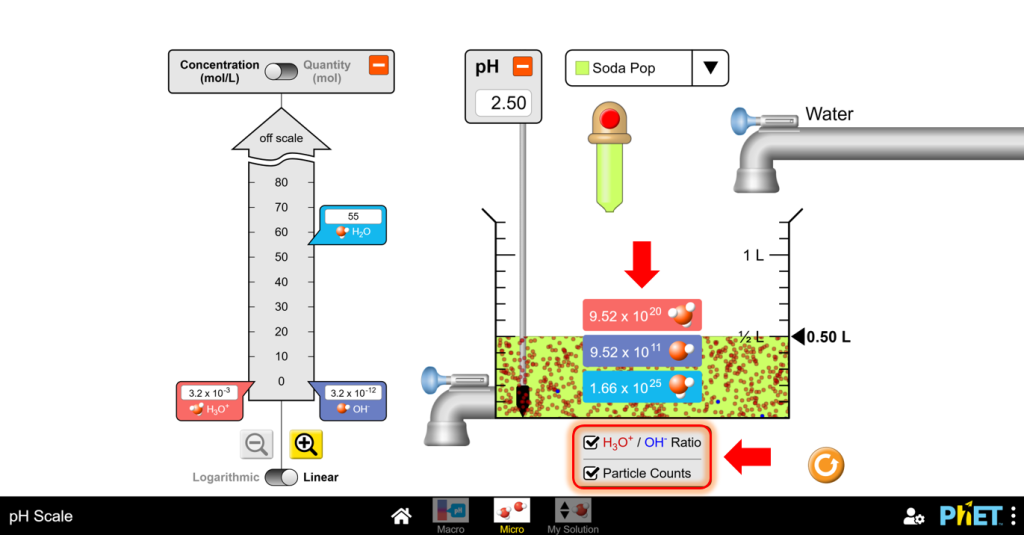
Step 6: Click the ““H₃O⁺/OH⁻ ratio”” button. Red dots represent hydronium ions, and blue dots represent hydroxide ions. This view helps compare the relative amounts of these ions.
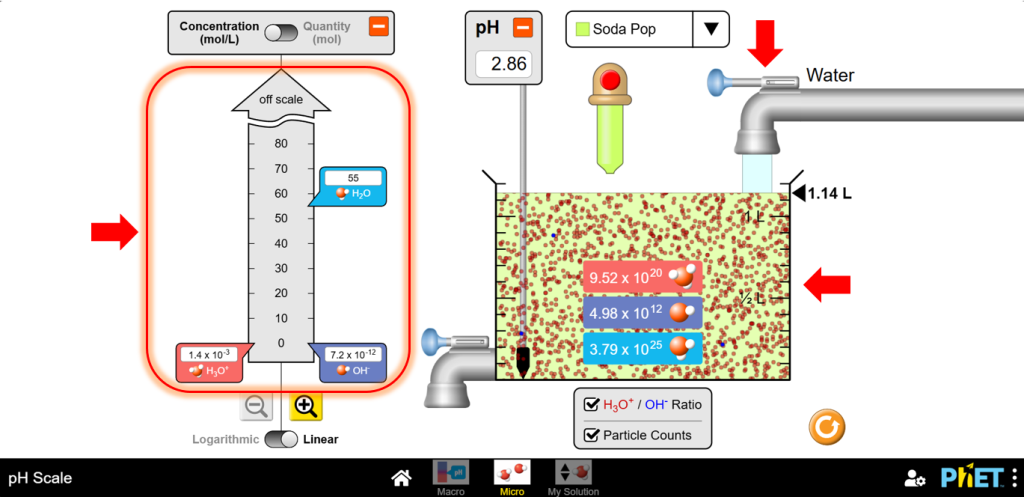
Step 7: Try adding water to the soda pop using the taps. The red dots (hydronium) should still dominate, but the gap between red and blue might appear smaller.
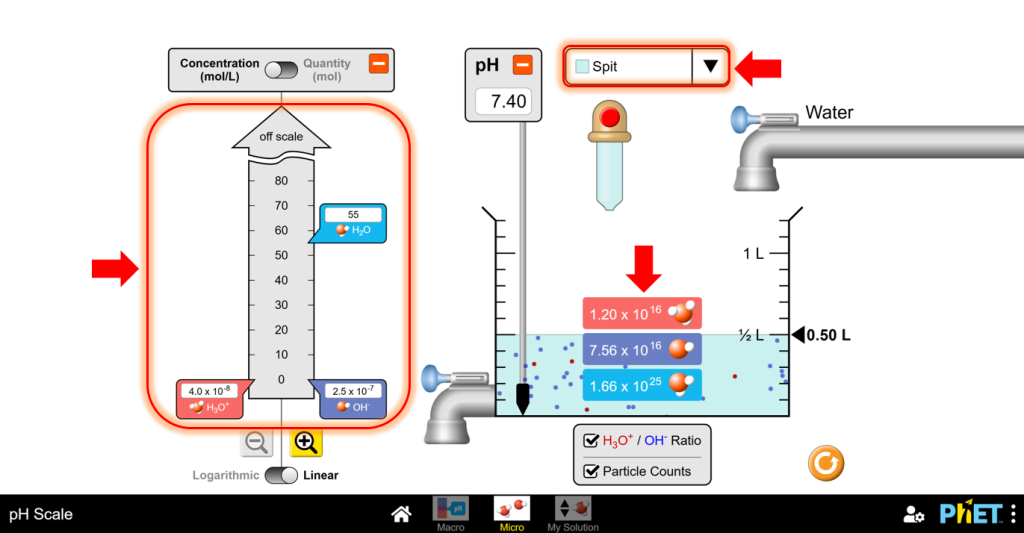
Step 8: Choose a solution with a neutral pH, like spit. In the ion ratio view, you should see roughly equal amounts of red and blue dots, reflecting a balanced concentration of hydronium and hydroxide ions.
Conclusion
This virtual pH scale simulation offers a valuable tool for 11th-grade chemistry students. By manipulating the simulation and observing the changes in ion concentrations, students can gain a deeper understanding of the relationship between pH and the microscopic world of ions in solution. This interactive approach can enhance their comprehension of a key concept in acid-base chemistry.