
Lesson 1
Aim
- The study and use of Braille for a tactile description of the periodic system of chemical elements of D.I. Mendeleev for people with visual impairment.
- 3D modeling and printing.
Teacher’s Guide
- To evaluate the project, in the first week, provide this material (PBLrubrics) to students in order to:
- – the students understood in advance what criteria they need to prepare for,
- – students were able to independently evaluate their colleagues.
- Before starting work, divide the class into teams of 4-5 students.
- Follow the instructions when working with electronic devices (current).
- Before the practical part, study all the necessary materials and devices.
Interdisciplinary communication:
– Chemistry
– Informatics
– Artistic work
Theoretical part

Key facts
Worldwide, at least 2.2 billion people are visually impaired near or far. In at least 1 billion cases, or nearly half, visual impairments could be prevented or have yet to be addressed.
The leading causes of visual impairment and blindness are uncorrected refractive errors and cataracts.
Most people with visual impairment and blindness are over 50; however, vision loss can affect people of all ages.
Visual impairment represents a huge global financial burden, with annual global productivity costs associated with visual impairment due to uncorrected myopia and presbyopia alone estimated at US$244 billion and US$25.4 billion.
Definitions
The International Classification of Diseases 11 (2018) classifies visual impairment into two groups: distance and near visual impairment.
The perception of visual impairment in a person depends on many different factors. This includes, for example, the availability of preventive and curative interventions, access to vision rehabilitation aids (including assistive devices such as glasses or white canes), and the person’s problems with inaccessible buildings, transportation, and information.
Prevalence
Worldwide, at least 2.2 billion people are visually impaired near or far. In at least 1 billion cases, or nearly half, visual impairments could be prevented or have yet to be addressed.
This 1 billion people includes people with moderate to severe distance vision impairment or blindness due to uncorrected refractive error (88.4 million), cataracts (94 million), glaucoma (7.7 million), corneal opacity (4.2 million), diabetic retinopathy (3.9 million). and trachoma (2 million), and near vision impairment due to uncorrected presbyopia (826 million) (1).
In terms of regional differences, the prevalence of distance vision impairment in low- and middle-income regions is estimated to be four times higher than in high-income regions (1). For near vision, rates of uncorrected near vision impairment are estimated to be over 80% in western, eastern and central sub-Saharan Africa, while comparative rates in high-income regions of North America, Australasia, Western Europe and The Asia-Pacific region is reported to be less than 10% (2).
Population growth and aging are expected to increase the risk of visual impairment in more people.
There are significant differences in causes between and within countries, depending on the availability of eye care services, their accessibility and eye literacy among the population. For example, the proportion of visual impairment associated with cataracts is higher in low- and middle-income countries than in high-income countries. Diseases such as glaucoma and age-related macular degeneration are more common in high-income countries.
Among children, the causes of visual impairment vary considerably from country to country. For example, in low-income countries, congenital cataract is the leading cause, while in middle-income countries, retinopathy of prematurity is more common. As in the adult population, uncorrected refractive error remains the leading cause of visual impairment in all countries among children.
Impact of visual impairment
personal influence

Young children with early onset severe visual impairment may experience delayed motor, language, emotional, social, and cognitive development with lifelong consequences. School-aged children with visual impairment may also have lower achievement levels.
Visual impairment seriously affects the quality of life of the adult population. Visually impaired adults often have lower rates of labor force participation and productivity, and higher rates of depression and anxiety. In the case of older people, visual impairment can contribute to social isolation, difficulty walking, a higher risk of falls and fractures, and a greater likelihood of early admission to nursing homes or nursing homes.
Sources:
Practical part
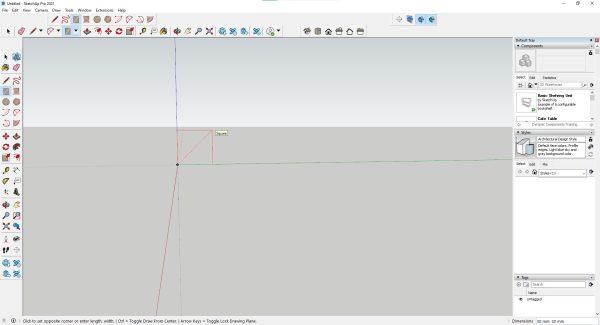
Step 1: Download SketchUp Pro, then open. Select template in millimeters:
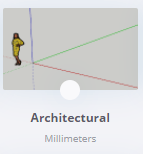
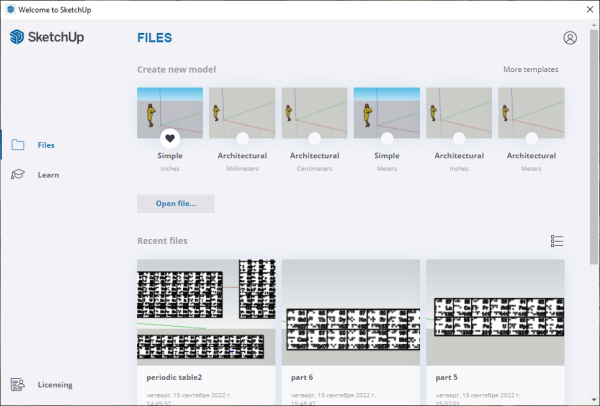
Then delete the object (the template where the person is depicted).
Step 2: Download the Long Version of the Periodic Table https://drive.google.com/file/d/13zd2N-LwN4xv10MBJTuQKtDQuO3BCkmB/view?usp=sharing
And Braille in English https://drive.google.com/file/d/1m55mM-48tSucWWoo9YmlQ2XD-DHkh9oA/view?usp=sharing
Step 3 Once you have opened SketchUp, select the Rectangle

command, then draw a 30*30mm square.
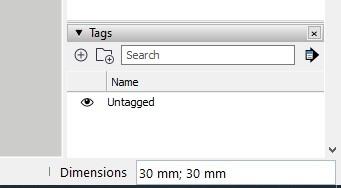
All dimensions are indicated on the lower right corner of the working window:
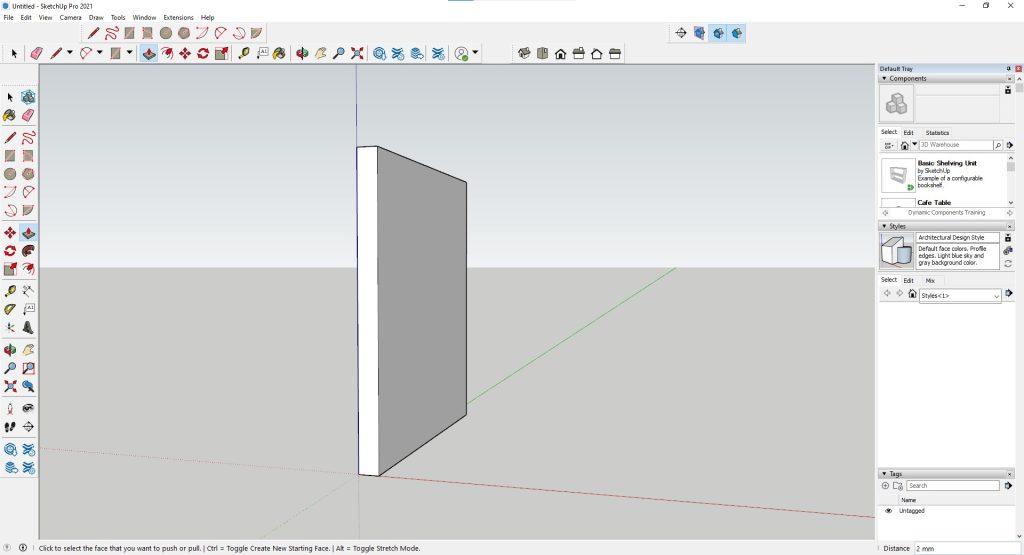
Step 4. Next, select the push/pull command

and pull out the square 2mm.
An object can be rotated 360 degrees using the command:

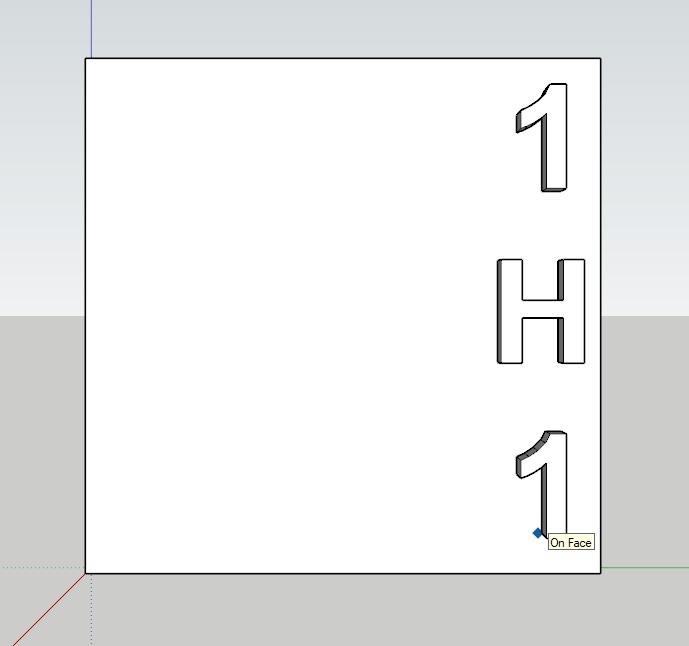
Step 5. Then select the text input command

The work page will come out, then type the text as shown in the figure: In this case, as a training, you will model only one element – hydrogen.
Enter hydrogen data: Ordinal number/Sign/Atomic mass
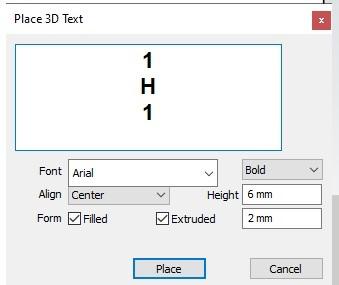
The parameters must be specified as in the figure.
Font – Arial
Location – in the center
Height – 6 mm
Thickness – 2mm
Filed/Extruded
Apply Bold Style to Text – Bold
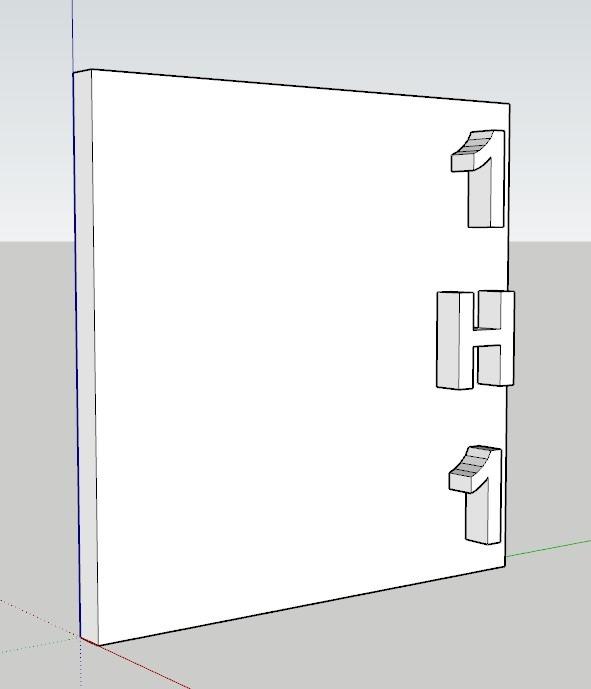
Then press the place command, and paste on the right edge of the rectangle, on the front side – On face.
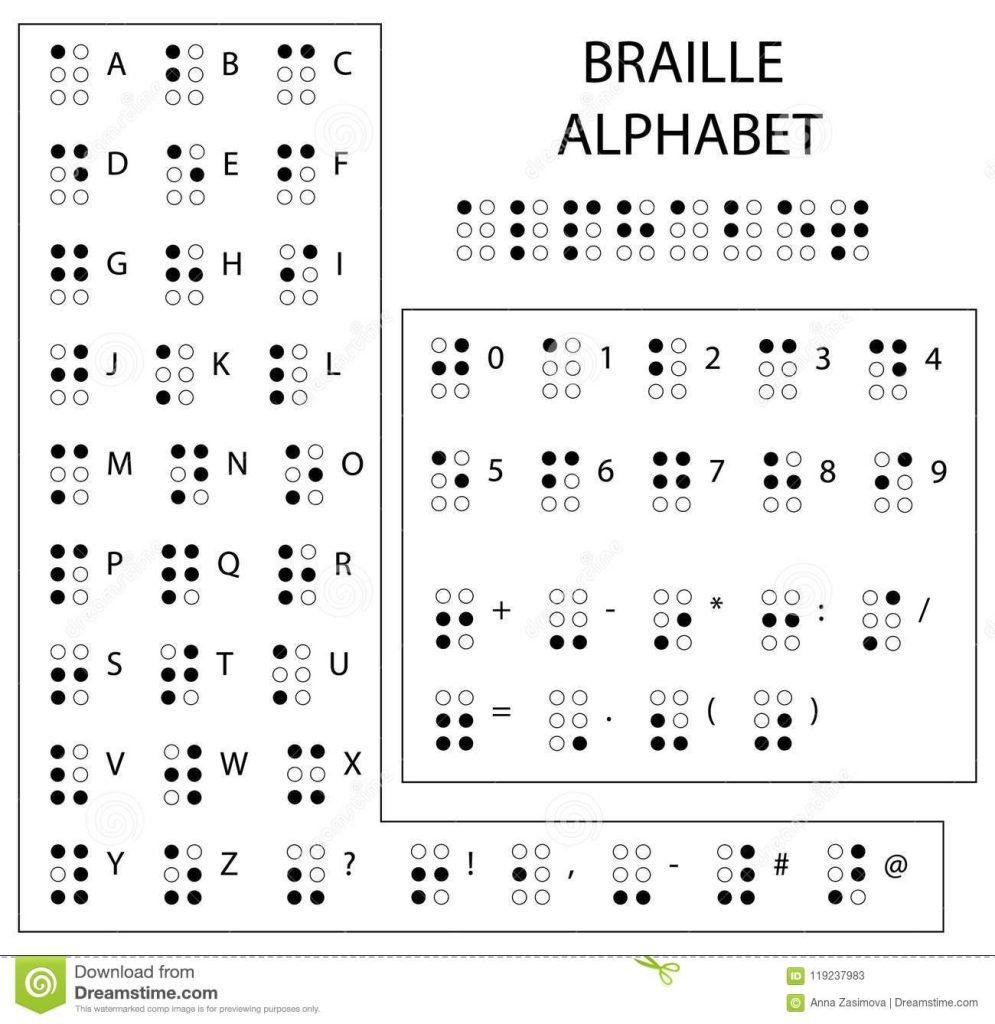
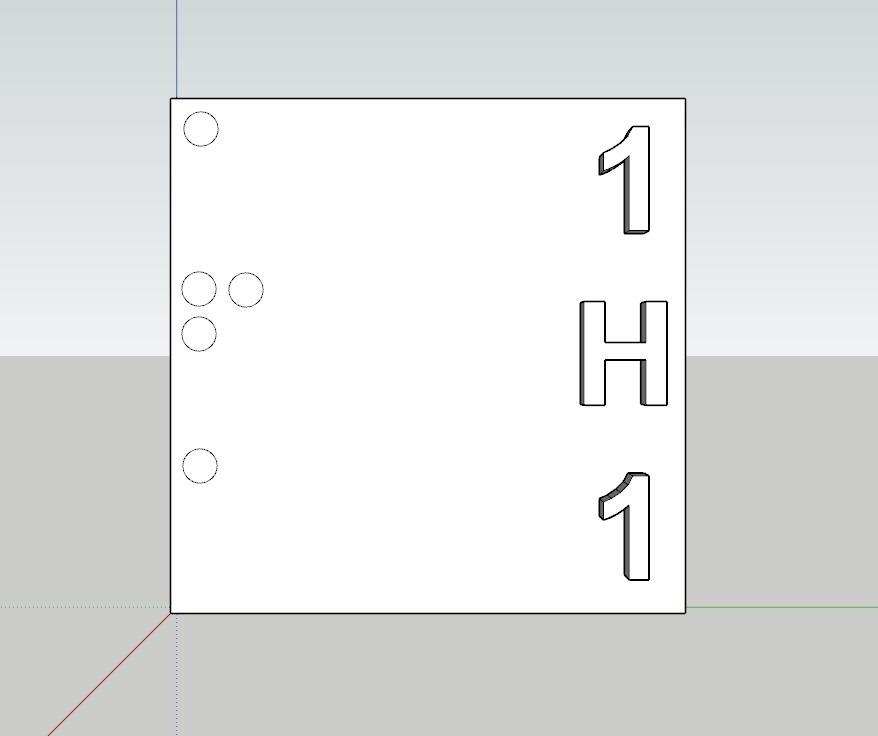
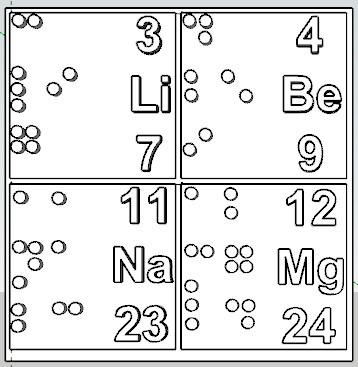
Step 6. After that, select the circle command, then draw circles in Braille:

The size of each circle is 1 mm. Observe the correct position of each circle


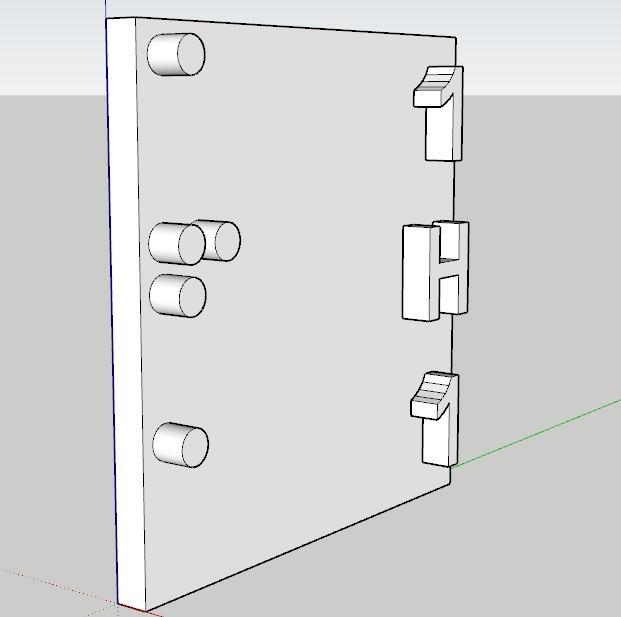
Step 7. After that, choosing the push / pull command

, pull the circles 2 mm forward.
Step 8. Next, the whole class needs to:
- split into groups (4-5 people)
- divide the entire periodic table into groups. For example, if there are 5 teams, each team can divide the entire table into 5 parts in groups or in order, depending on your preference.
- And also the members of each team among themselves, respectively, must distribute several elements. For example, each student will model 4 or 6 elements or/and so on.
- Division example:
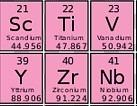
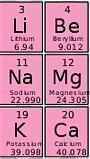
As a sample, we chose 4 elements of groups I and II, these are Lithium, Beryllium, Sodium and Magnesium.
Step 9. Now draw a rectangle, in this case, if there are 4 elements of 30 mm each, then the size must be selected 60 * 60mm.
Step 10 Then extrude this rectangle only 1mm.
Step 11. After that, draw 4 more cells with a size of 29 * 29 mm on the surface of the elongated rectangle, and after that, extend each cell only by 1 mm.
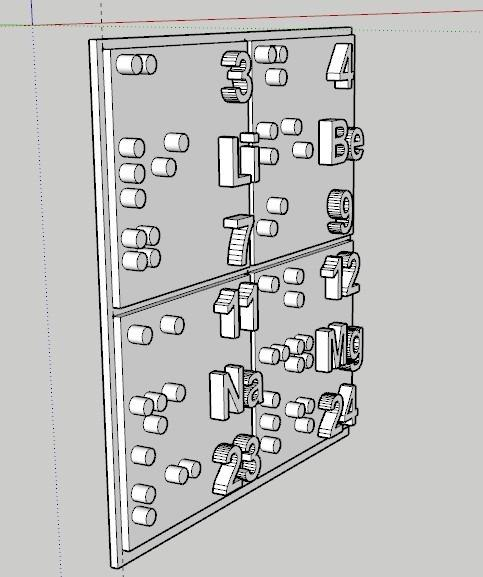
Step 12. Then repeat step 5, step 6 and step 7 for each cell, respectively, here the value of each element is changed instead of hydrogen.
Step 13. This is the object that will come out.
Do the same for groups of other elements.
Watch the full video tutorial below.

In addition, you can use ready-made table thumbnails.
Homework
- Explore scientific and educational projects, materials that are intended for people with visual impairments. Prepare a presentation of your choice. What innovative technologies and engineering solutions are offered on the world market.
- Social responsibility. As a class, think about what solutions you can offer from your own to blind people, or people with disabilities in general. And start taking action!
- In the next lesson, you will send your finished models (parts) of the periodic table for 3D printing.