
Lesson 1
Topic of the laboratory: Study of process of heating and boiling
Purpose of the work:
- Students should understand the mechanism of changing aggregate states
- Students should understand the principle of changing the temperature of substances
Teacher’s Guide:
- Tasks are performed in groups of 3-4 people
- Working with an electric stove requires increased attention
Expected results:
- Students understand how the aggregate states are changing
- Students are able to draw a reverse heating schedule
Theory
Vaporization is the process by which a substance changes from its liquid state to a gaseous state, typically as a result of increasing temperature. Water serves as an excellent example to illustrate this phenomenon.
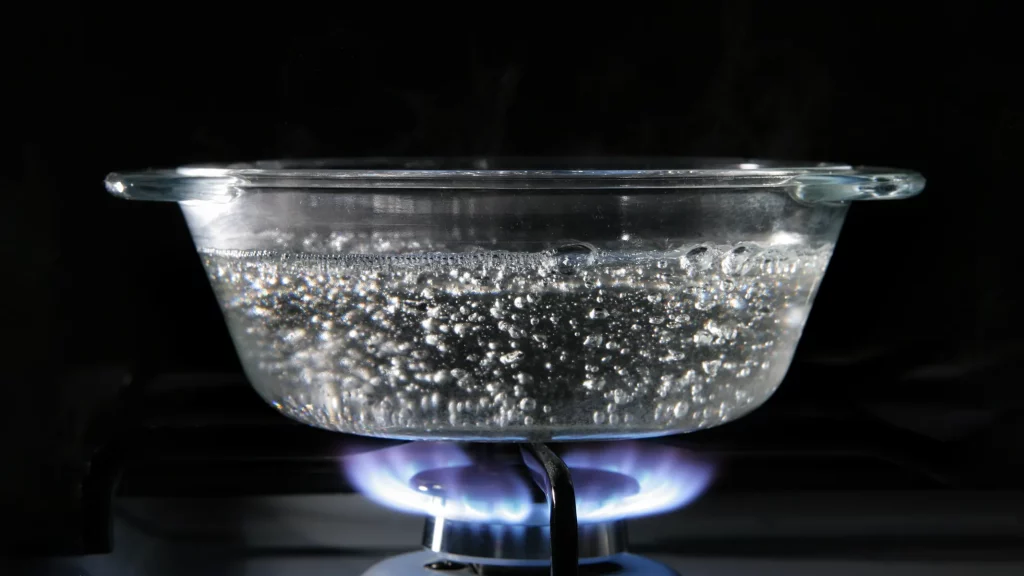
As you heat water, its temperature increases, and you can observe the process of vaporization on a temperature vs. time graph. Here’s a brief explanation of what you would see on such a graph:
1. Initial Temperature Rise: At the beginning, the water is in its liquid state, and as heat is applied, its temperature begins to rise steadily. This initial phase is characterized by a linear increase in temperature as energy is transferred to the water molecules, causing them to move more rapidly.
2. Plateau at the Boiling Point: As the water continues to heat up, it reaches a critical temperature known as the boiling point. At this point, the temperature remains constant, even though heat is continuously being added to the system. This plateau on the graph indicates that the energy being added is used to break the intermolecular forces holding the water molecules together in the liquid state, rather than increasing the temperature. During this phase, the water undergoes a phase transition from a liquid to a gas.
3. Continued Temperature Rise: Once all the water has vaporized, the temperature of the gas (water vapor) begins to rise again in a linear fashion, as the added heat energy causes the gas molecules to move faster.
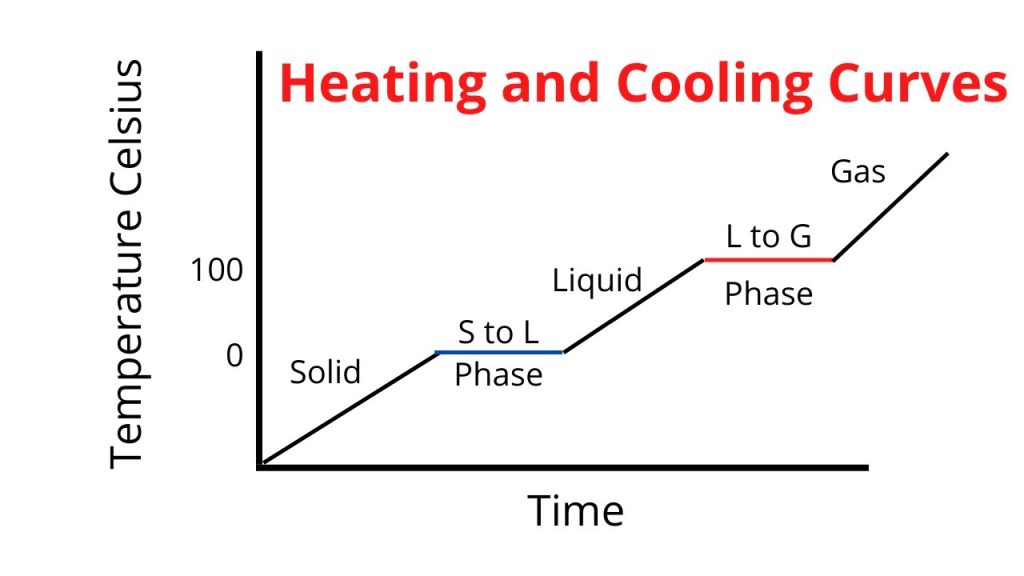
The plateau at the boiling point is a critical feature of the temperature vs. time graph for water and is a direct result of the energy required to break the hydrogen bonds between water molecules during vaporization. It’s worth noting that the boiling point of water at standard atmospheric pressure is 100 degrees Celsius (212 degrees Fahrenheit).
Understanding this graph and the vaporization process is not only important in everyday activities like cooking but also in various scientific and industrial applications, such as power generation, distillation, and climate science, where the behavior of water vapor plays a crucial role.
Materials
- Electric stove
- Measuring cup
- Thermometer
- Water
- Paper
- Pencil
- Ruler
Practical part
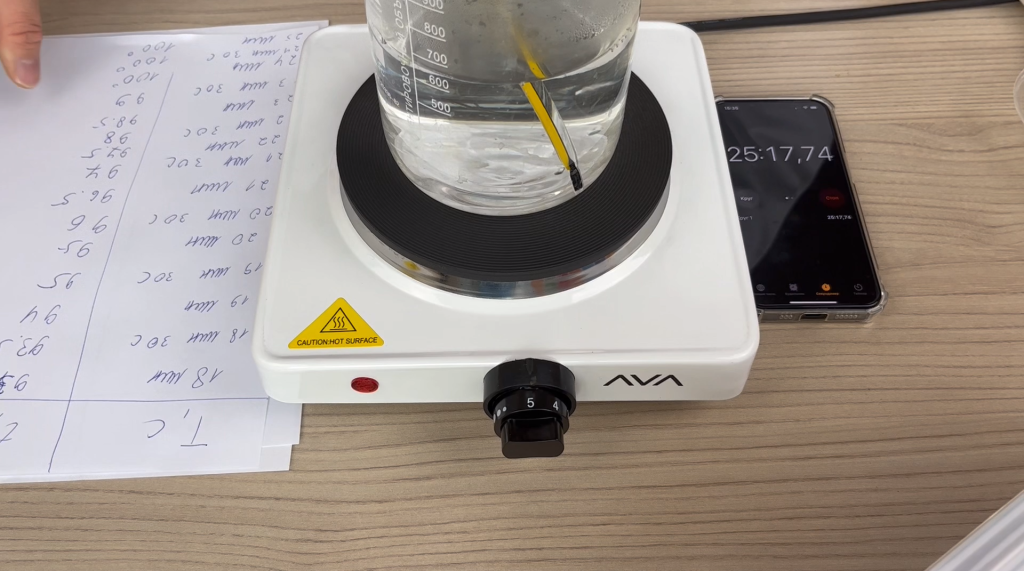
1. Fill the big beaker with 500-600 ml of water
2. Lower the thermometer into the water and wait a minute
3. Write down the initial temperature in the table
4. Turn on the electric stove and timer
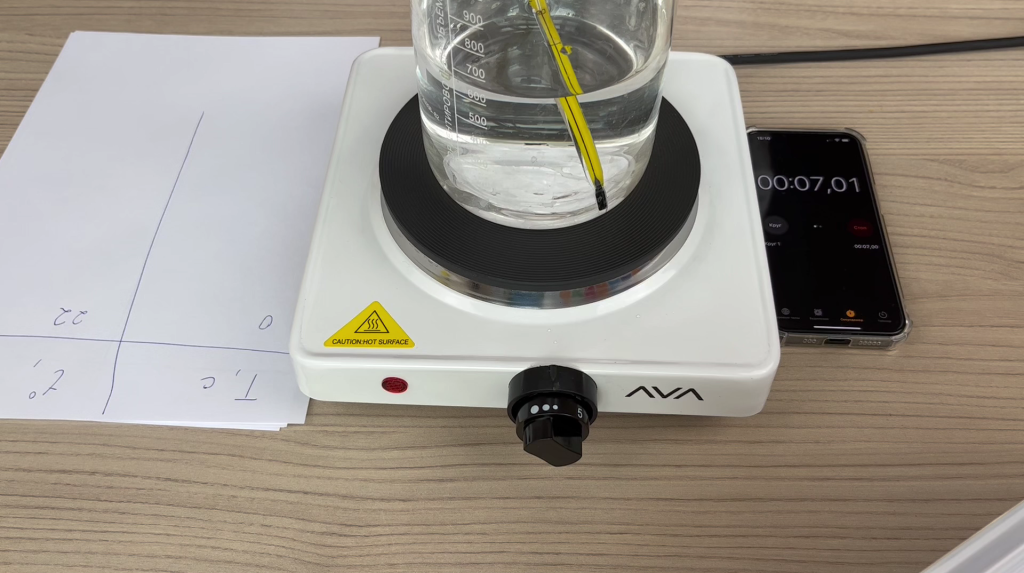
5. Record the temperature every 30 seconds
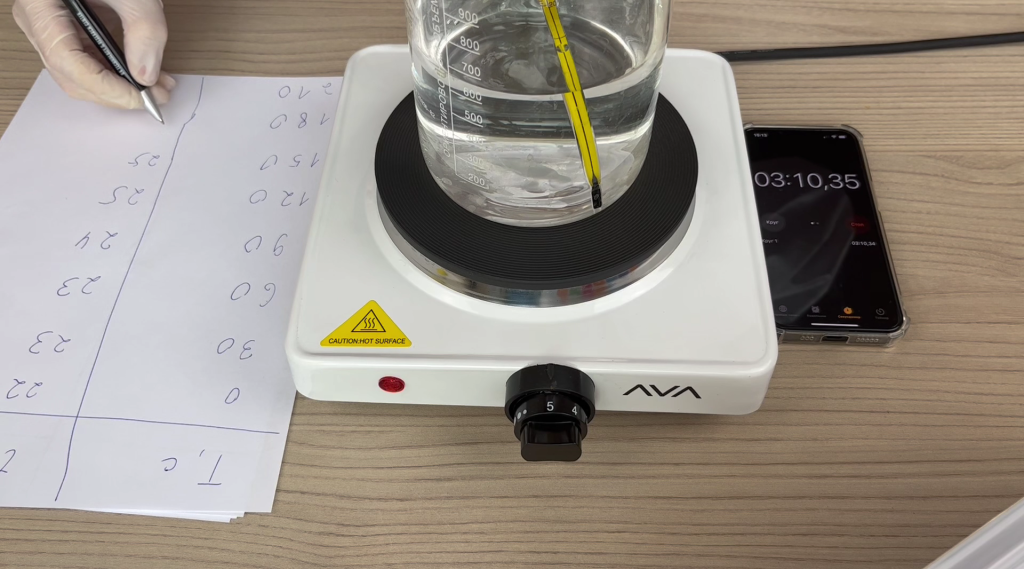
6. As soon as the temperature reaches 100 degrees Celsius, record the data for another two minutes
7. Turn off the tile
8. Build a table based on the collected data
9. Make conclusions
Rules for designing the laboratory work
The laboratory work should contain items in the following order:
- Laboratory work number
- Topic name
- Purpose of the work
- Hypothesis
- Brief description of the theoretical part
- Equipment
- Steps in the correct sequence
- Add a photo from the experiment (if you can’t insert a photo, you can add a picture)
- Give a brief description
- Write a brief discussion and explanation of the topic covered
- Write the conclusion of the work
- The workplace must be cleaned and put in order
Worksheet
Feedback
Safety technique