
Lesson 3
Statistics
In this lesson, we will analyze the data collected in the previous lesson. Here will be an example with the answers that we suggested in the last lesson. You use your collected data from homework.
Take your survey results and tabulate as we did last week, if needed. So you will be more comfortable and clearer. Now let’s make diagrams by questions. To build the diagram, free services from the Internet were used. You can calculate the percentage yourself in the lesson by proportion and draw a diagram manually, and use special programs for presentations at home. Our main goal is to find out how many people have vision problems. For this we had a question:
- Do your eyes see well? 18 answered “no” and 5 answered “yes”.
Let’s show the answer in the form of a pie chart.
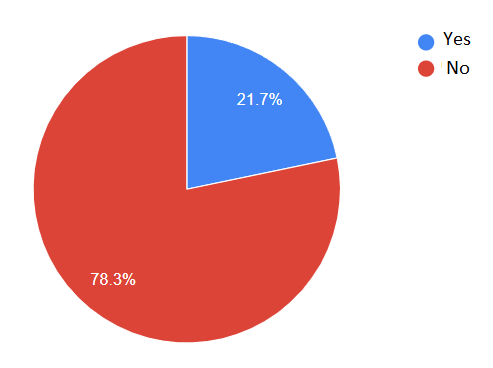 | Here we see that 78.3% have complaints about vision. More than a quarter of the class does not see very well, so based on the result, we can say that there is an eye health problem and it needs to be addressed. Of course, this is just an example and there are very few interviewees here, but your data that you have collected can show the real picture. |
Now we will find out how many of them have been checked by a doctor and know the real diagnosis. To do this, we use a donut chart. She, like a pie chart, is good when you need to divide the answers into shares.
- Have you been checked by an ophthalmologist?
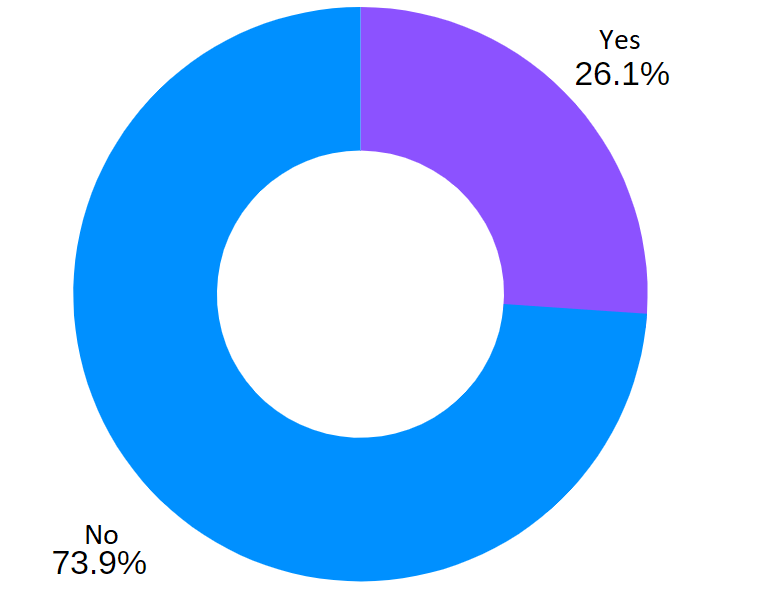 | It can be seen from the diagram that many of the students consciously and responsibly treat their health and are checked by a doctor on time. What picture did you get? |
We need to find out how which diopter indicators prevail among the respondents. To do this, we use a histogram. The histogram is useful for comparison.
- If checked, what is the diopter value?
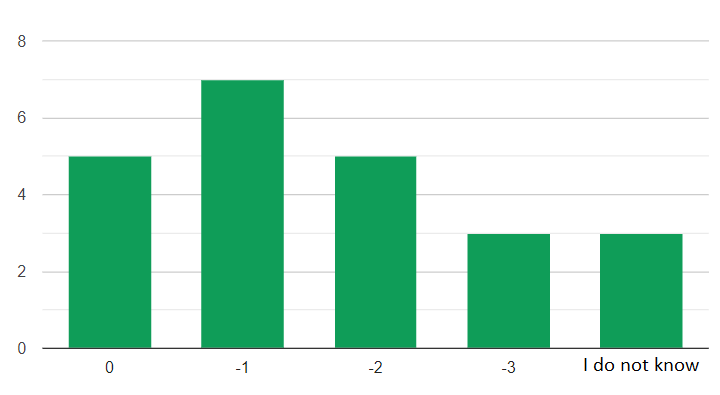 | Here we see that many have an indicator of -1. And the fewest people with -3 and those who do not know yet. |
Now let’s find out what correction methods are popular with people. To compare the answers, we use a horizontal histogram.
- Do you wear glasses? (according to the data from table 11 they wear glasses)
- Do you wear contact lenses? (4 students wear lenses)
- Have you had vision correction surgery? (one student had surgery)
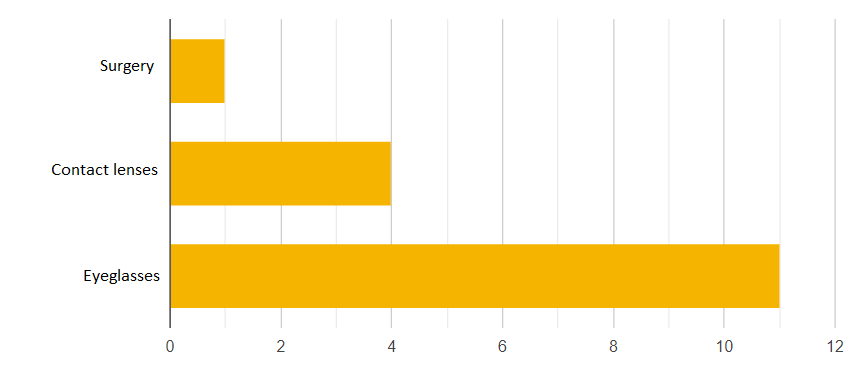 | From the histogram, it is immediately clear that among the respondents, eyeglasses are the most popular as a method of vision correction. |
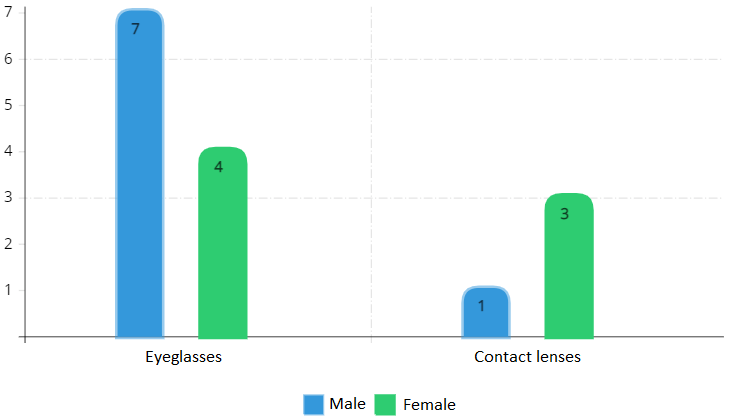 | And here we see that boys wear glasses in many respects, and girls prefer lenses. |
Now let’s try to see if visual acuity depends on age. You can use a line chart for this.
- How old are you?
- Do you see well?
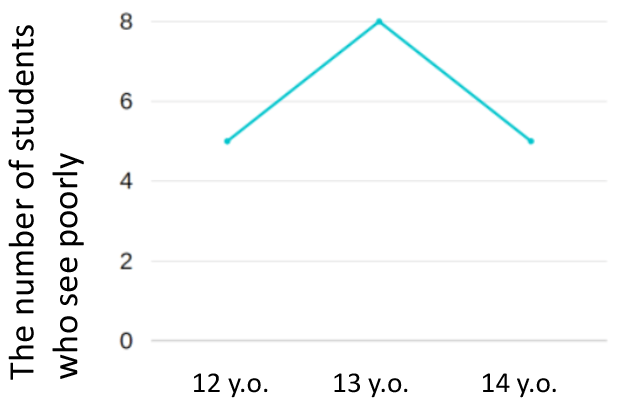 | On the graph, we see that 5 students of 12 years old have complaints, 8 students of 13 years old do not see well and 5 students of 14 years old do not see very well. We have very little data so we can’t say anything. Students in the same class are about the same age. You can divide by age or class. |
These were examples of how you can make graphs, then you can make your own dependency diagrams, comparisons, division by shares, etc.
Results
Thus, we clearly see that there is a problem of visual acuity in society. This can be facilitated by the current environmental situation, prolonged work at a computer, smartphone, reading in the wrong lighting and other factors.
Problem solution
Let’s think about what solutions we can offer. Brainstorm, think and offer your options.
At the moment, there are several main methods for improving vision:
- Vision correction with glasses;
- Vision correction with contact lenses;
- Operational methods (surgical intervention).
Homework
Each team will have to prepare a full presentation with the data obtained from the polls compiled by the graphs. Draw your own conclusions based on the statistics obtained. Three teams will each take one of the three main methods for improving vision and reveal it. Teams should talk about the advantages and disadvantages of your method.
It will be great if the students conduct a full study and try to answer questions such as:
- What kind of people is your method suitable for?
- What is the proposal in the local market that offer a solution?
- What is their approximate cost?
- Reviews.
- Can you suggest a good company for patients?