
Lesson
Purpose of the work:
- To explore the range of frequencies and intensities that the human ear can perceive.
- To learn how to measure and map individual hearing sensitivity using a simple method.
Expected results:
After completing the work, students can:
- develop teamwork skills
- be able to analyze and summarize the information received
- draw logical conclusions
Teacher’s Guide:
- The task is performed individually
- Before starting laboratory work, please read the safety rules by following the link:
- To download the worksheet, follow the link:
Theoretical part
Understanding how humans hear: a fun experiment with sound!
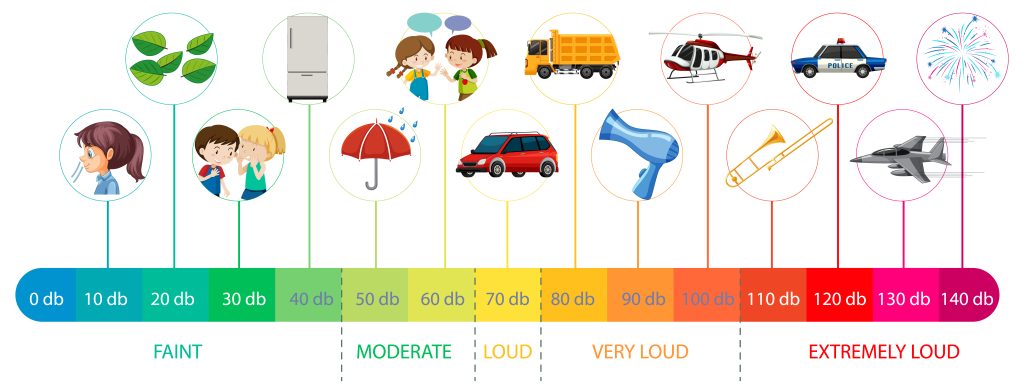
Our ears are amazing! They can pick up a huge range of sounds, from deep rumbles to high squeaks. On average a young person is able to hear frequencies ranging from 20 to 20,000 Hz (Hz is the abbreviation for Hertz, the name for units of cycles/sec). This experiment lets you measure this range for yourself: you’ll discover how sensitive you are to different pitches and volumes.
The secret lies in decibels: This unit tells us how much louder or softer one sound is compared to another. It’s not just convenient, it matches how we actually hear! The quieter the situation, the easier it is to notice even tiny changes in sound.
Practical part
To map your hearing curve, you’ll listen to 19 special audio files given below. Each file plays a single pitch, but the tones gradually fade away (getting 3 dB quieter each) until they disappear.
Step 1. Adjust your computer volume to comfortably hear the upcoming tones.
- Put on your best quality headphones for crystal-clear listening.
- Find the quietest spot you can to avoid sneaky background noises messing with your results.
- Play the 3500 Hz sequence and adjust the volume until you can only hear the first 18-19 tones. Remember, there are 25 in total, so this means the last 6-7 sounds should be faint whispers you can’t quite catch.
- Note down the number of tones you hear clearly at 3500 Hz. Keep this volume fixed for all the other tests.


Step 2. Play each sound file and count how many tones you can hear.
- Do this five times each for accuracy.
- Track your counts in the table provided in your Worksheets.
Step 3. Turn your “hear counts” into “threshold levels” for different frequencies.
- We’ll use your 3500 Hz score as a reference point (like a zero point on a map).
- Each tone in the files is 3 dB quieter than the last, so use that to calculate your threshold for each frequency.
- To calculate your threshold value for a given frequency, take the average count for that frequency, subtract it from your count for 3500 Hz, multiply this number by 3 dB (because each tone in the sequence is decremented in amplitude by 3 dB) and then add -4 dB.For example, if you heard 5 tones at 100 Hz compared to 18 at 3500 Hz, your threshold for 100 Hz would be 35 dB.
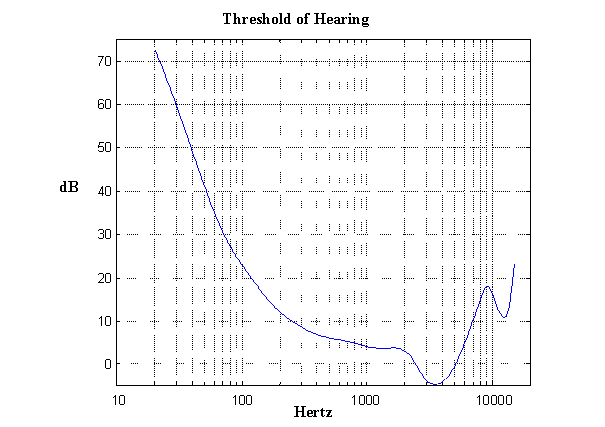
Step 4. Graph the results on semi-log graph paper.
- Follow the example diagram below and graph your own Threshold of Hearing vs. Frequency curve on semi-log graph paper. link
- The frequency is plotted on the logarithmic scale (where the lines for each order of magnitude get closer and closer together), and threshold is plotted on the linear scale.
- If you can’t find semi-log graph paper, you can plot threshold vs. the logarithm of the frequency.
- Compare your results to the standard curve below.
Conclusion
In this experiment, students investigated the limits and characteristics of their own auditory perception. Through a series of controlled listening tasks using specially designed audio files, they explored decibels as a quantitative measure of sound intensity, not just as numerical values, but as the basis for how humans experience sound changes.
By progressively detecting fainter tones at various frequencies, students established their personal thresholds for different pitches, generating individual auditory sensitivity profiles.