
Lesson
Purpose of the work:
- to understand the capabilities and limitations of human vision
- to explore the different ways human perceive visual information
Expected results:
After completing the work, students can:
- develop teamwork skills
- be able to analyze and summarize the information received
- draw logical conclusions
Teacher’s Guide:
- Students work in pairs to complete the task
- Before starting laboratory work, please read the safety rules by following the link:
- To download the worksheet, follow the link:
Theoretical part
Blind spot – it’s a small area in your visual field that you cannot see due to the anatomy of your eye. It is located where the optic nerve exits the retina and connects to the brain. There are no light-sensitive cells in this area, so you are literally blind to anything that falls within that specific spot. However, you don’t usually notice this blind spot because your brain is very good at filling in the missing information from your other eye.
The vast array of perceived colors arises from specialized photoreceptor cells within the retina, each sensitive to specific light wavelengths. Variations in these cells and their pigments lead to diverse color experiences, impacting not only individual perception but also communication and cultural interpretations of color symbolism.
Practical part
Experiment #1: Find your blind spot
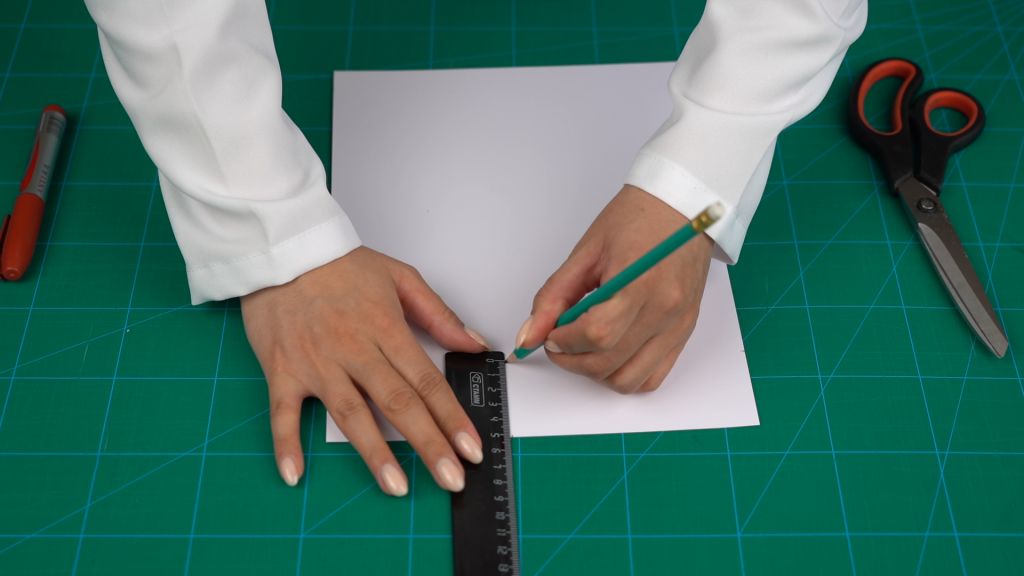
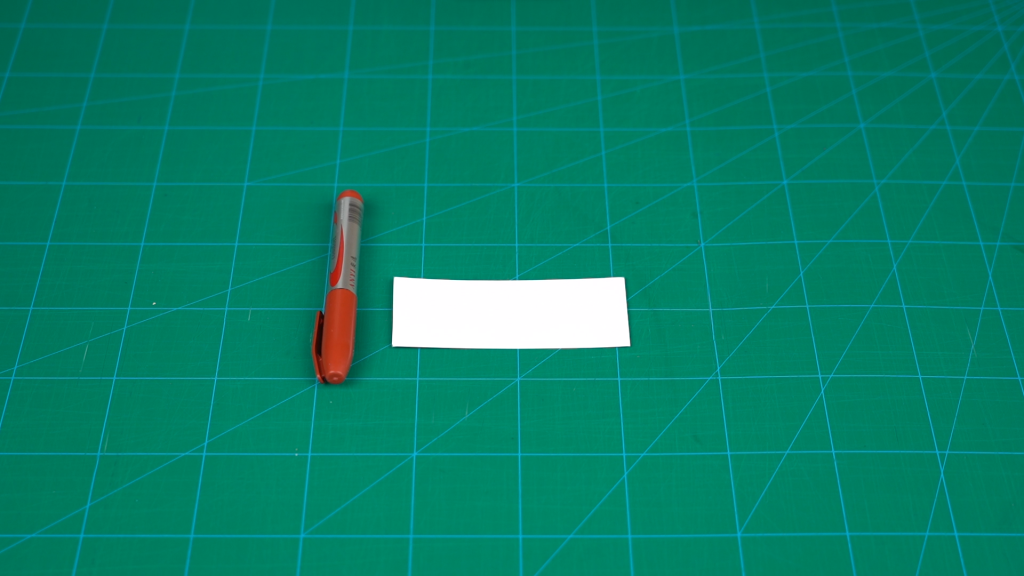
Step 1. Grab some cardstock and cut a strip 5 cm tall and 12 cm long.
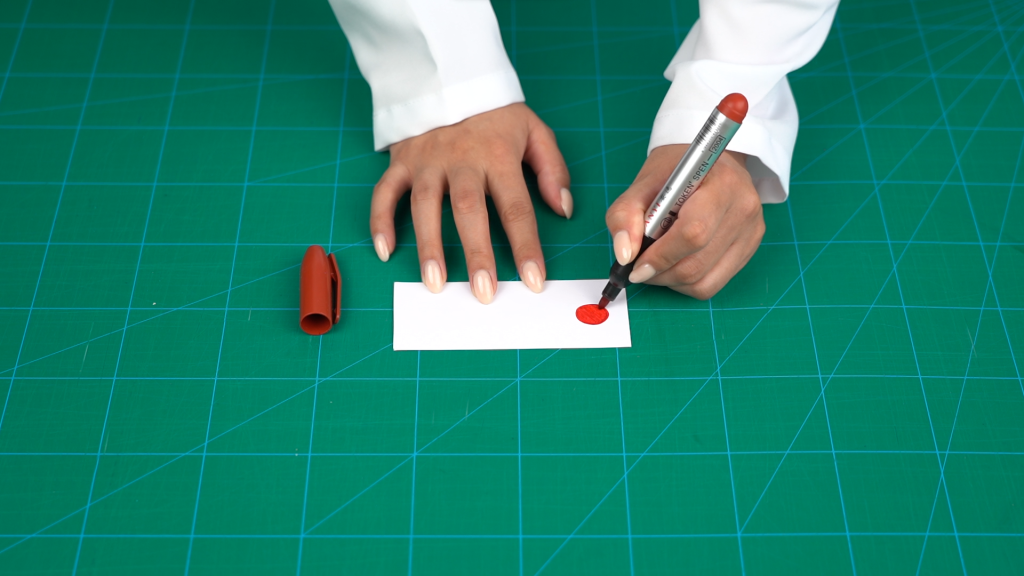
Step 2. On the left side of the strip, draw a clear shape like a circle or plus sign, but keep it under 1.5 cm wide.
Step 3. Repeat Step 2 on the right side, drawing another distinct shape within the same 1.5 cm width limit.
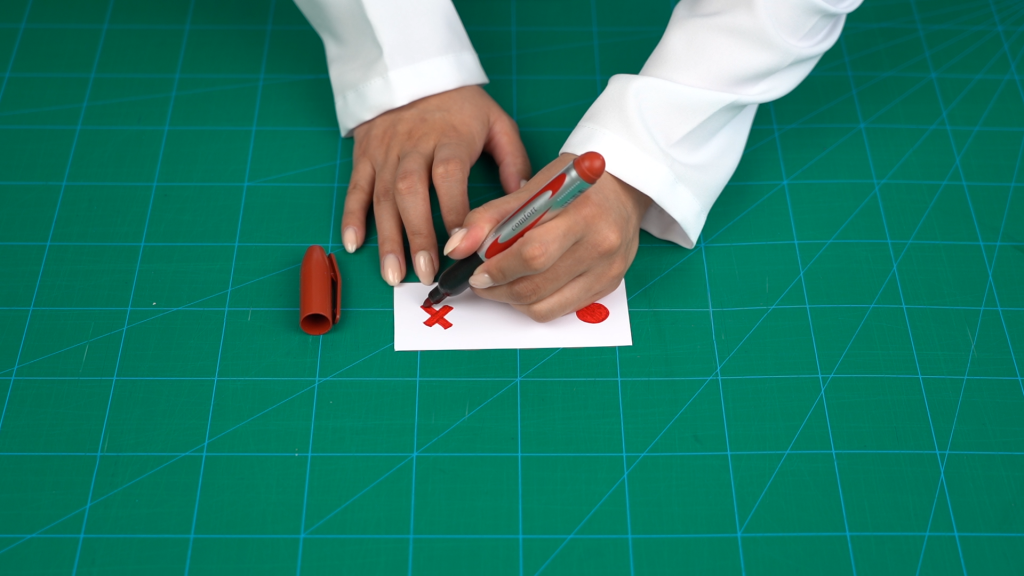
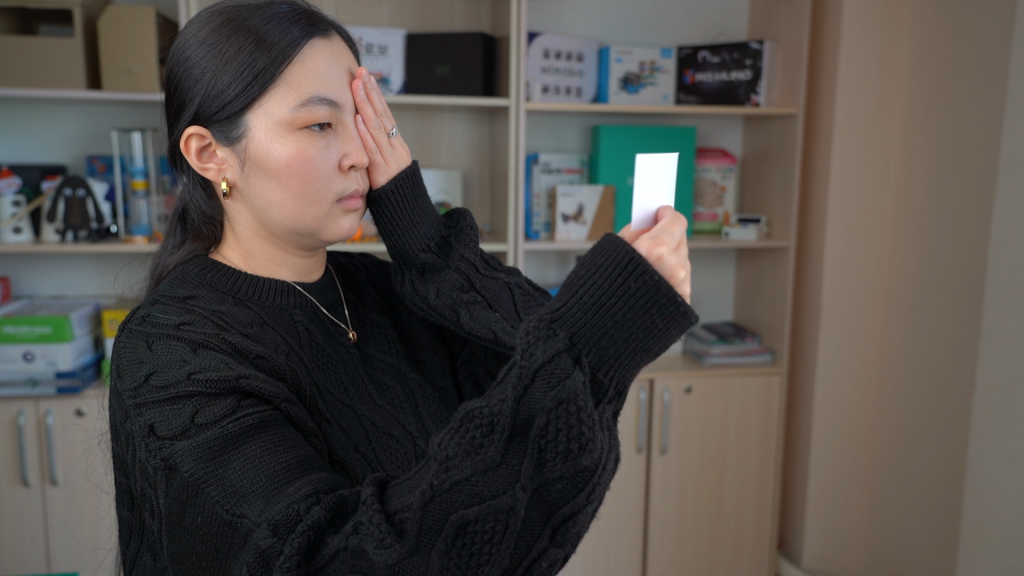
Step 4. Now hold paper on eye level. Cover your right eye and focus your left eye on the right shape, then slowly bring paper closer.
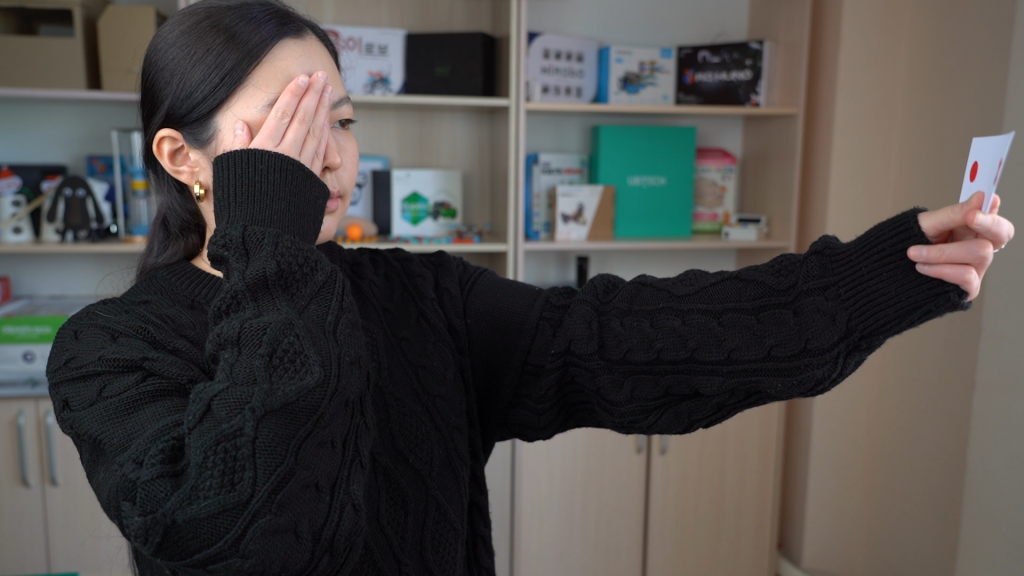
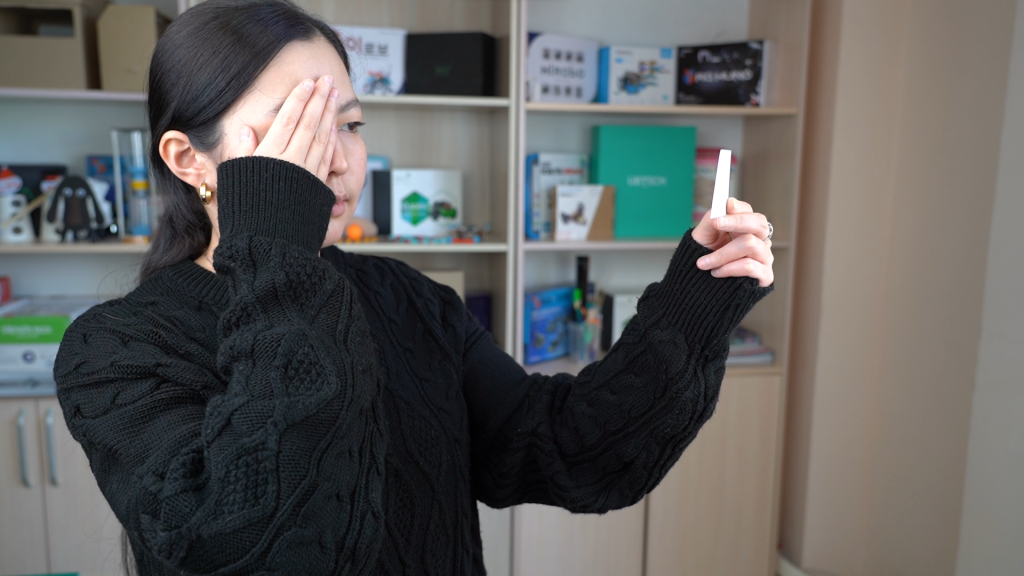
Step 5. Does the left shape vanish? That’s your blind spot! Freeze and measure the distance using a ruler or measuring tape
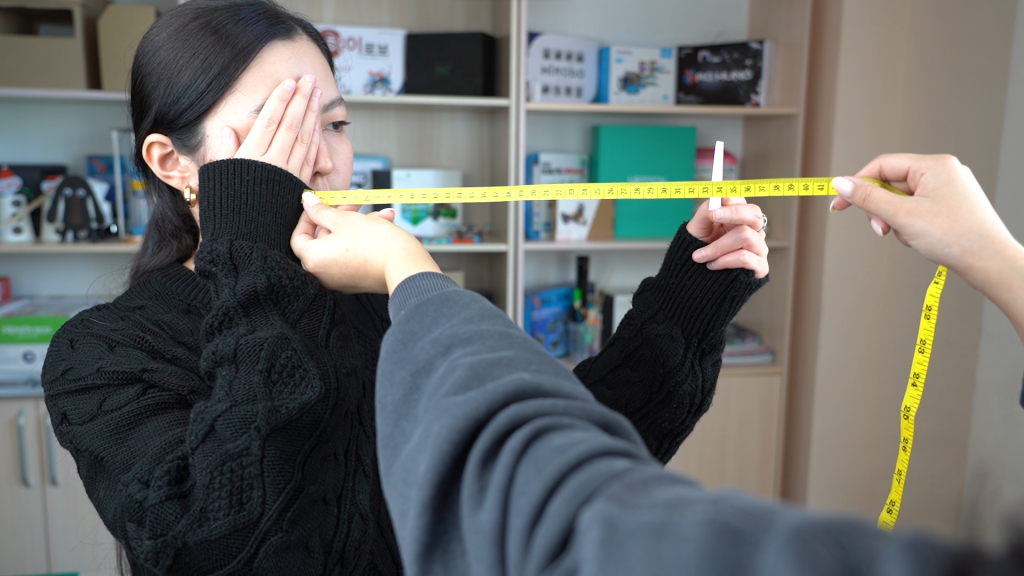
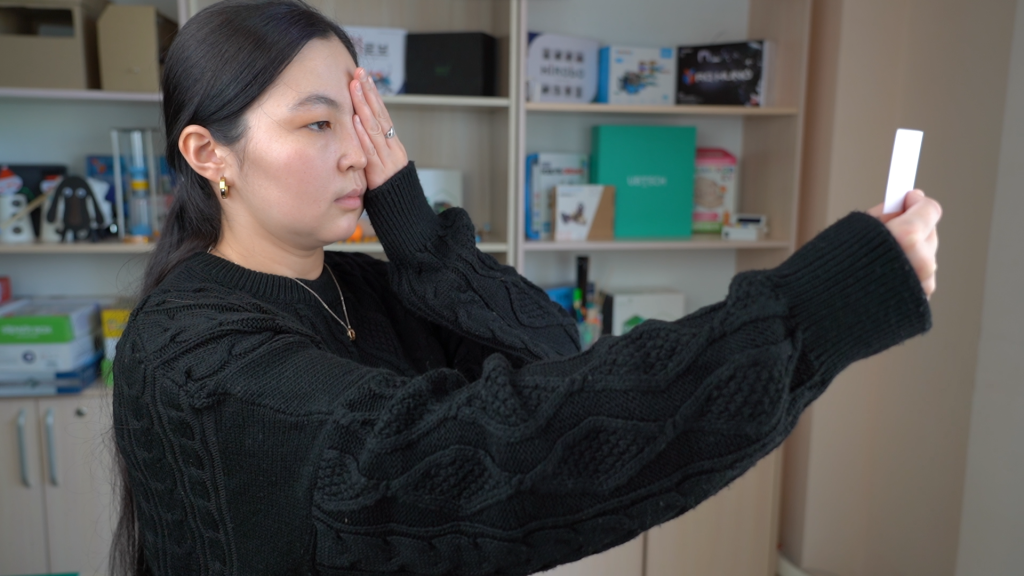
Step 6. Repeat with right eye on the left shape. Share and compare your results with your classmates.
Experiment #2: Stare and Observe Afterimages
Step 1. Look at a red circle for 30 seconds (try not to blink). Observe the afterimage in white space. Link

Step 2. Repeat two more times, recording how long the afterimage lasts each time.
Step 3. Repeat steps 1-3 for stare times of 5, 10, 20, and 60 seconds. Record all data (stare time, afterimage duration) in a table below.
Table 1.
| Afterimage persistence (seconds) | ||||
| Cone stimulation (seconds) | 1st | 2nd | 3rd | Average |
| 5 | ||||
| 10 | ||||
| 20 | ||||
| 30 | ||||
| 60 | ||||
Answer the questions:
- What is the longest duration of afterimage?
- Does increasing cone stimulation always increase the afterimage duration? Explain the term “cone cell fatigue.”
- How can we explain the relationship between cone stimulation duration and afterimage duration?
- What role do afterimages play in our everyday vision?
Adviсe:
- For more accurate results, use a stopwatch.
- Remember: a bright screen/printout is required. Give your eyes a rest between tests.
- Make notes immediately after you no longer see the afterimage.
Conclusion
Through these experiments, students discovered their blind spot. They also explored afterimages, visual illusions caused by staring at an object. By observing how afterimage duration changes with viewing time, students learned about cone cell fatigue and how it affects color perception. This hands-on activity provided a glimpse into the amazing capabilities of human vision.