
Study the graph of a function using the derivative
Calculus Grapher by PhET Interactive Simulations, University of Colorado Boulder, licensed under CC-BY-4.0 (https://phet.colorado.edu)
Objective:
- To know the geometric and physical meaning of the product;
- To study the graph of a function and the graph of its derivative;
- Create a tangent to the graph of a function at a given point.
This virtual activity is designed to be used in the math lessons in the next chapter:
- Grade 10. “Applications of the derivative.”
Theory
A derivative is a mathematical function that shows the rate of change of another function. Studying the graph of the derivative provides valuable information about the behavior of the original function.
1. The relationship between the graphs of f(x) and f'(x)
The points of intersection with the x-axis: The x-coordinates of the points of intersection of the graph of the derivative with the x-axis are the points of extremum (maximum or minimum) of the original function.
Intervals of monotonicity:
If f'(x) > 0 on the interval (a, b), then f(x) is increasing on this interval.
If f'(x) < 0 on the interval (a, b), then f(x) is decreasing on that interval.
Local maxima and minima:
A point x0 is a maximum point of f(x) if f'(x0) > 0 and then f'(x) < 0.
A point x0 is the point of minimum of f(x) if f'(x0) < 0 and then f'(x) > 0.
Asymptotes:
The horizontal asymptote y = L if limx → ±∞ f(x) = L.
The vertical asymptote x = a if limx → a f(x) = ±∞.
2. Algorithm to study the graph of the derivative
- Find the zeros of the derivative f'(x) = 0.
- Arrange the points x0, where f'(x) = 0, and the points xa and xb, where f'(x) is undefined, on the numerical axis in ascending order.
- Determine the sign of f'(x) in each interval between the points found, using a test point from the interval.
- Analyze the signs of f'(x) and make inferences about monotonicity, extrema, and asymptotes of f(x).
- Using the information obtained, construct a graph of f'(x).
Virtual Experiment
The Exploring the Graph of a Function Using the Derivative virtual activity allows students to explore and determine relationships between the graphs of a function and its derivative. On the derivative screen, students can change the function and view the graph of its derivative.
Course of work:
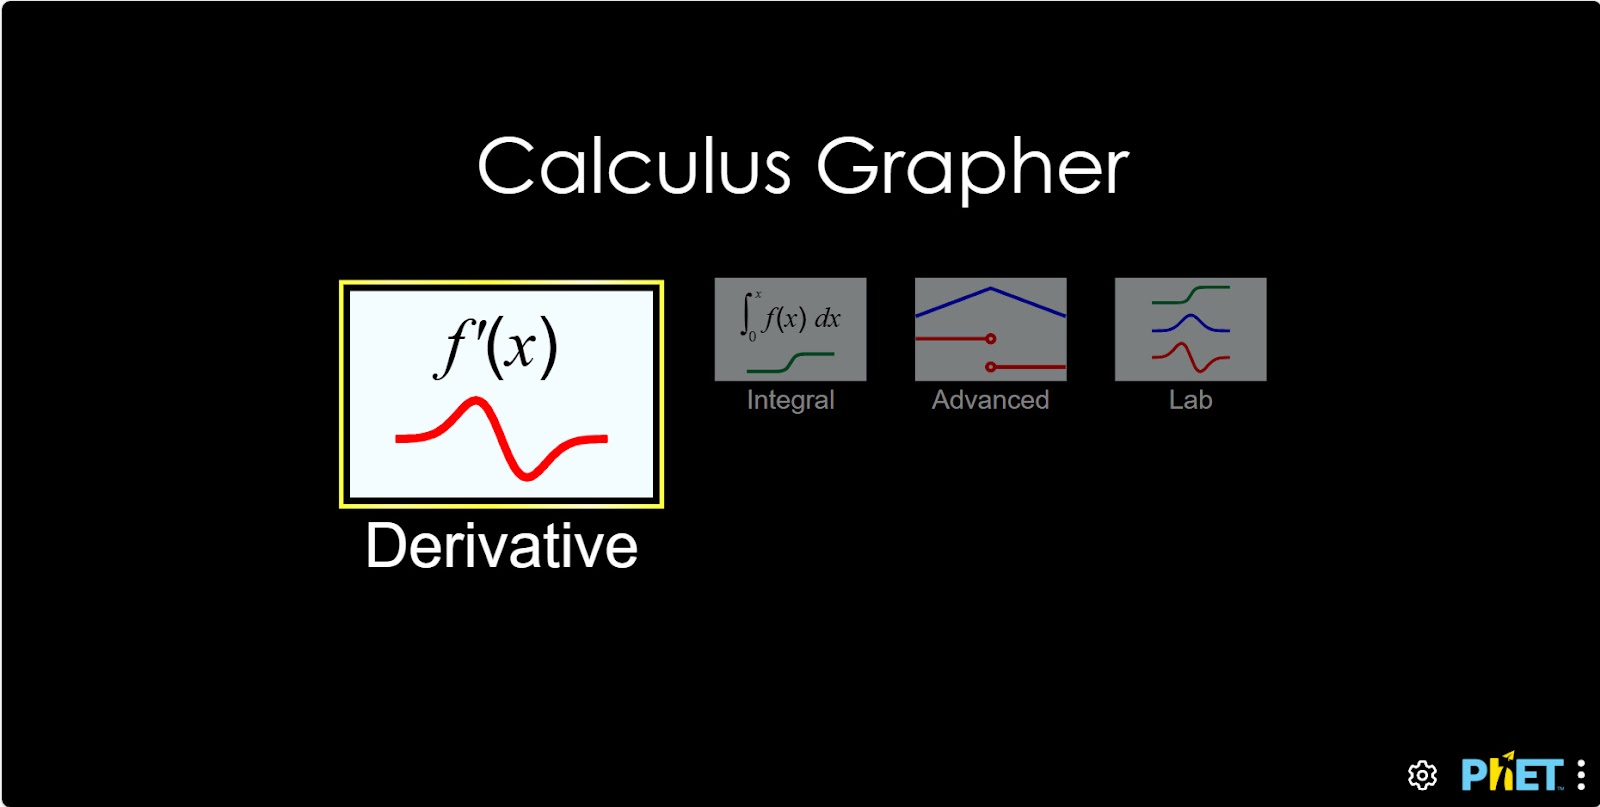
Step 1. Start the simulation: You will be presented with 4 different modes: “Derivative”, “Integral”, “Advanced” and “Lab”. In this work, you will be working in the “Derivative” section. Open the “Derivative” section.
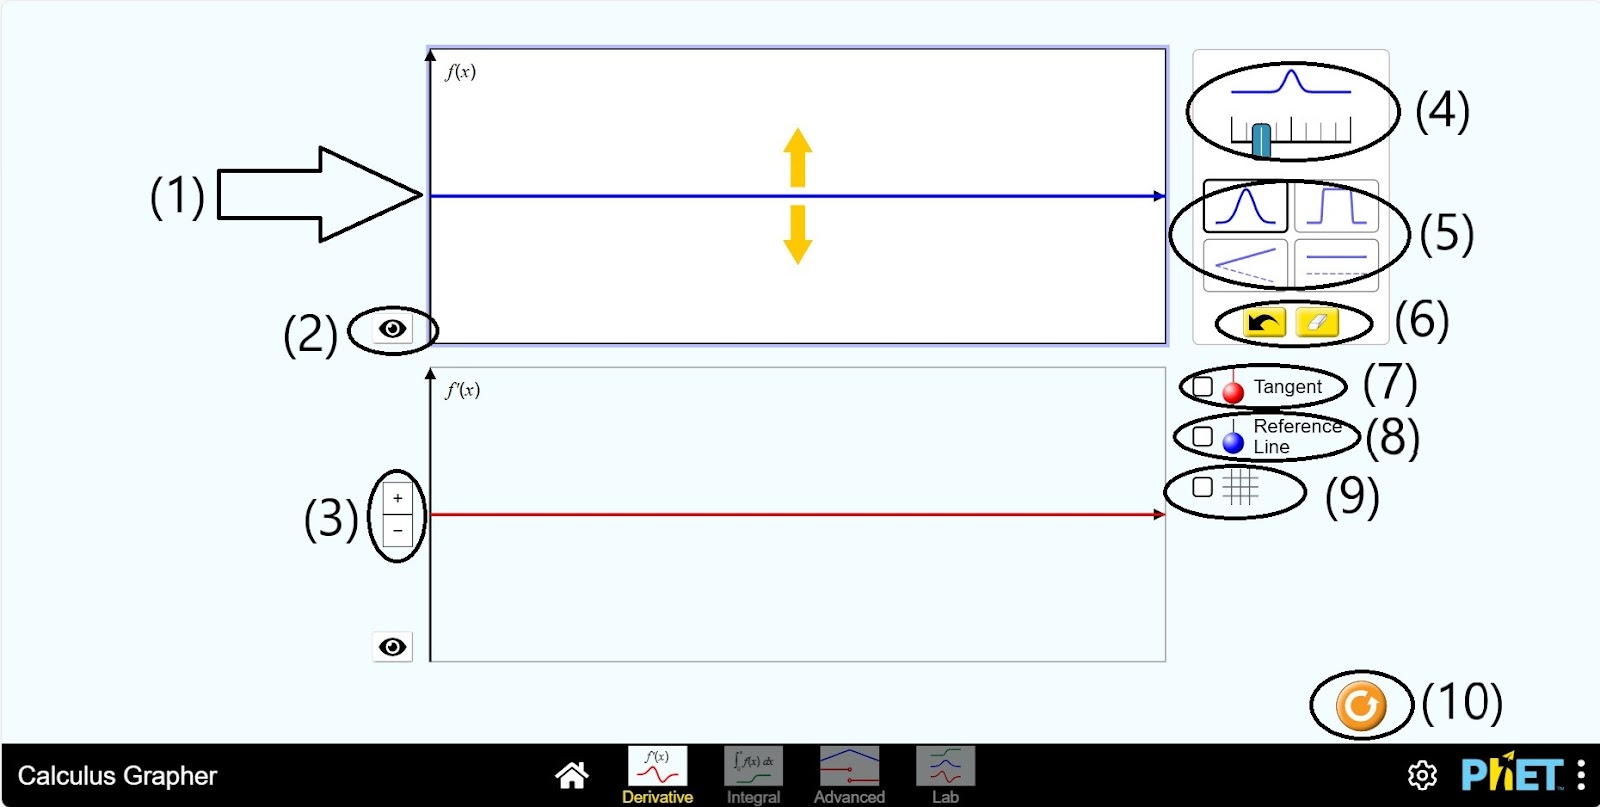
Step 2. In the workspace provided to you:
- The planes on which the graphs of f(x) and f'(x) are displayed (1);
- You can hide the graph with the eye button (2);
- A button to zoom in and out of the plane on which the graphs of f'(x) are displayed (3);
- There are 4 different types of graphs for f(x) (4);
- You can select the wave volume for plot type 1-2 (5);
- Back and Erase buttons (6);
- Tangent graph display button (7);
- Baseline straight line button (8);
- Plane grid display button (9);
- Reset button (10).
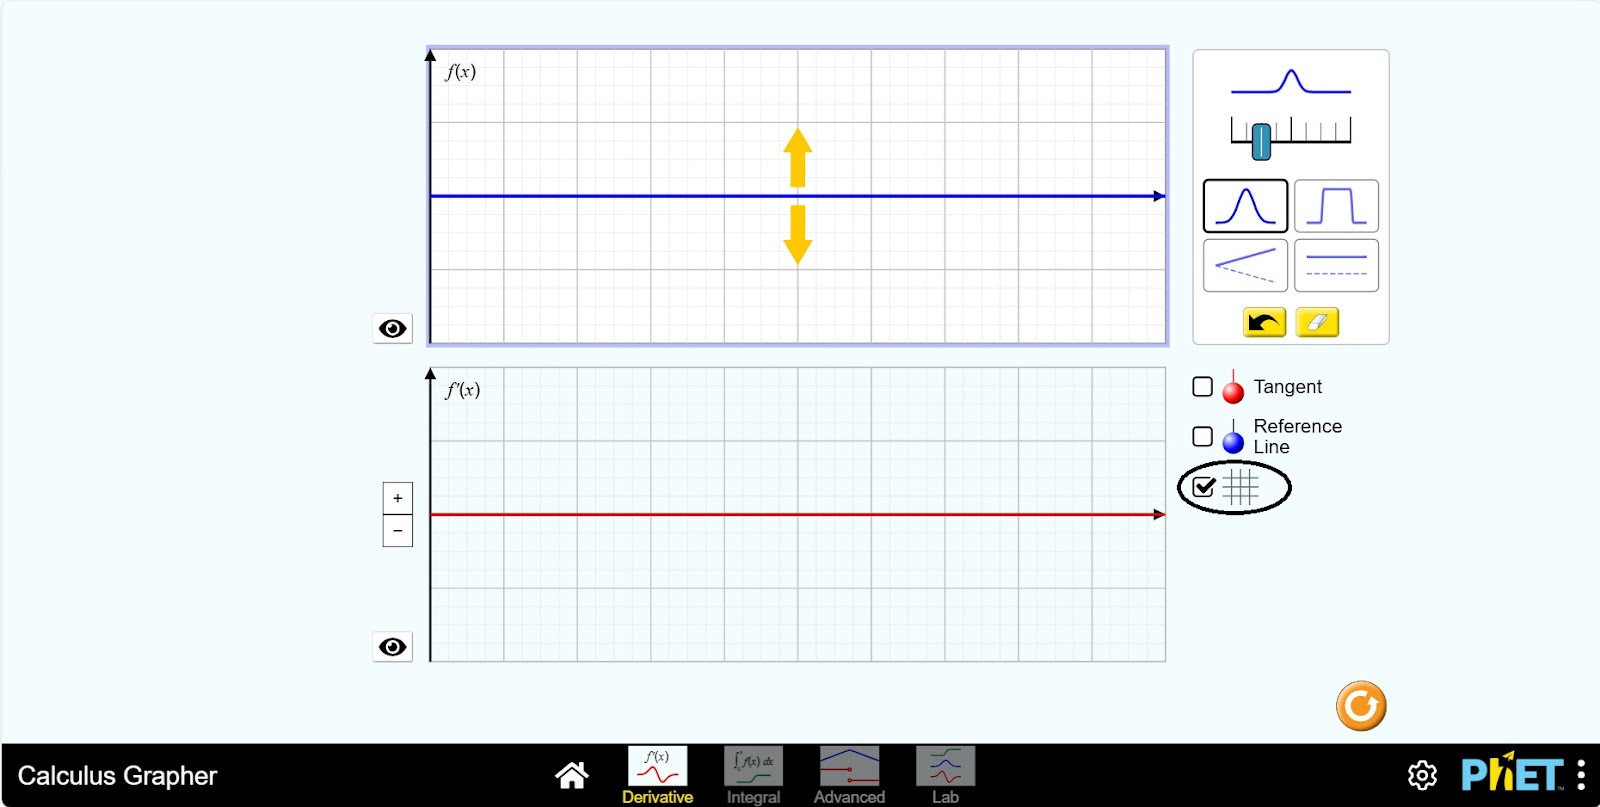
Step 3. Click the Planes grid display button.
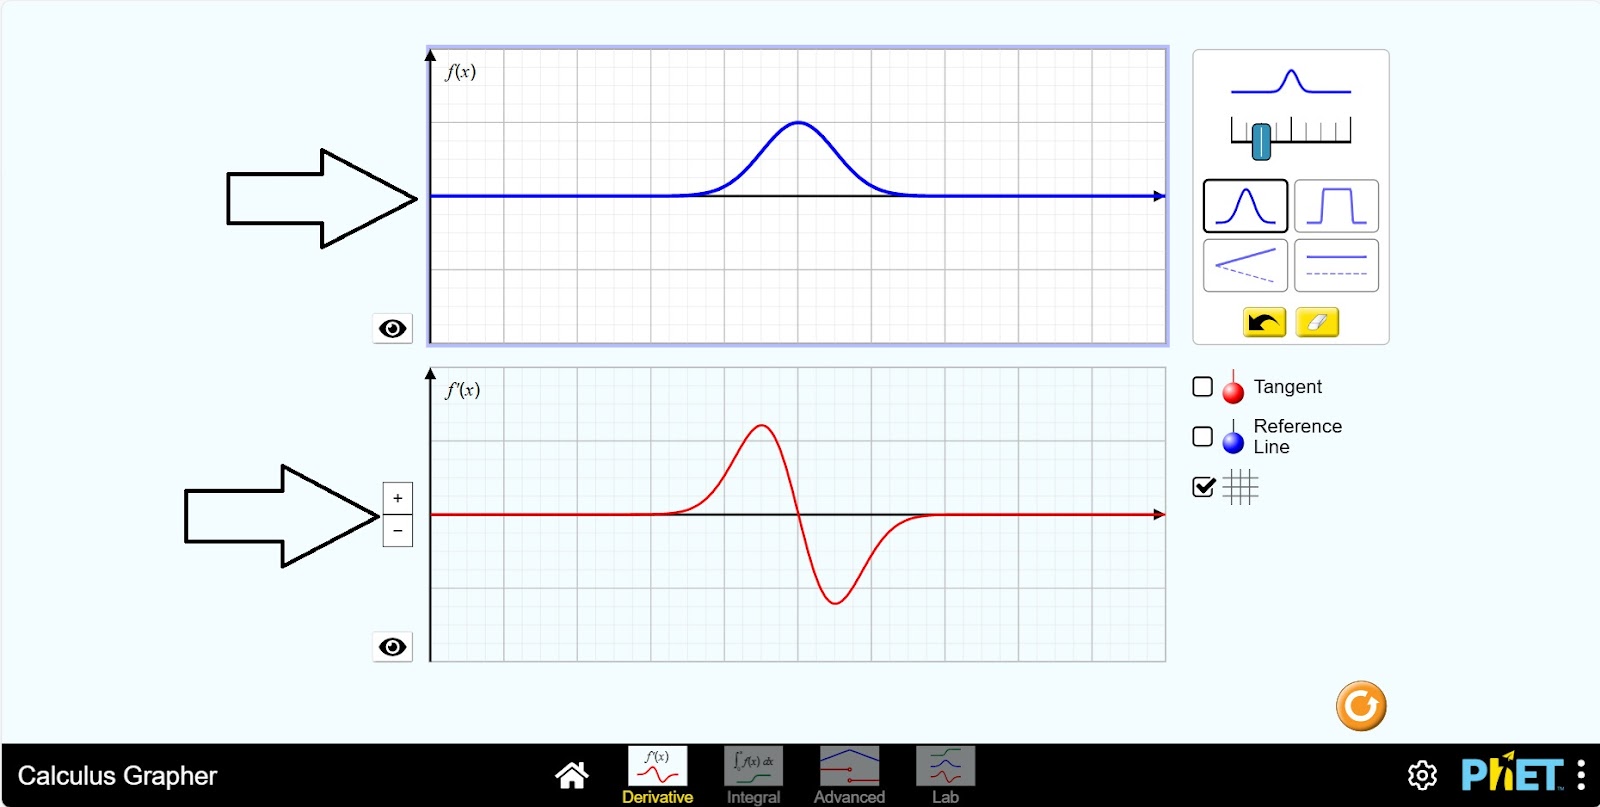
Step 4. Draw the graph of the function f(x). Draw the graph by raising or lowering the blue line along the OX axis. If you raise the line, it is the function – cos(x), if you lower it, it is sin(x). You will automatically have a graph of the derivative in the lower plane. If f(x)=cos(x), then f'(x)=sin(x). If f(x)=sin(x), then f'(x)=cos(x).
Step 5. Click view Tangent graph. A discontinuous line with a red straight line and a round head appears on the screen. Explore the movement of the tangent graph by moving the wheel over the graph of the function. You can also see that the tangent has a different value in each part of the graph in the panel that appears on the left.
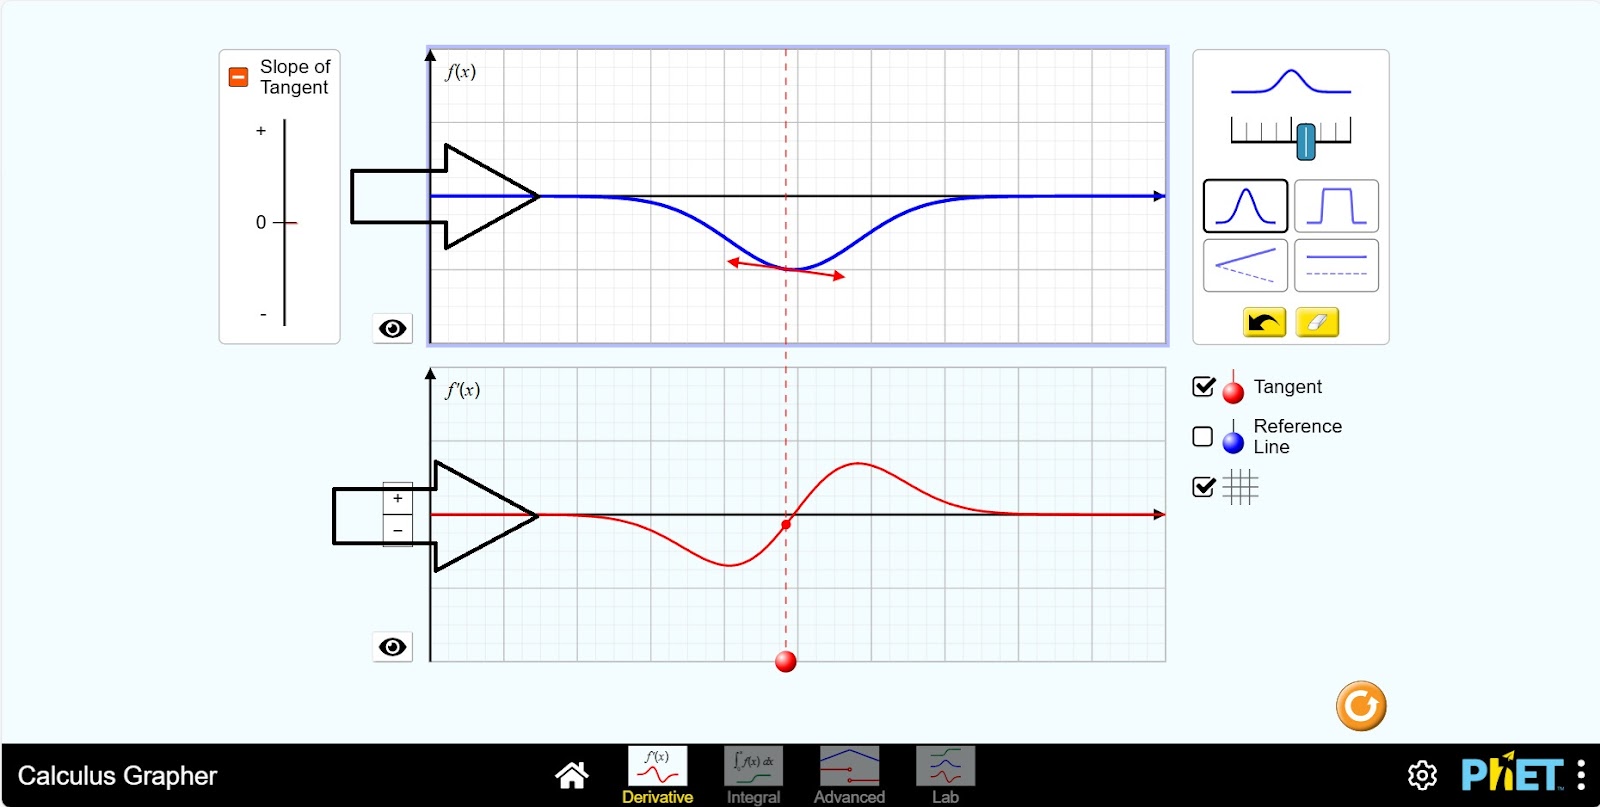
Step 6. Delete the graph on the plane by clicking the eraser. Change the volume of the wave.
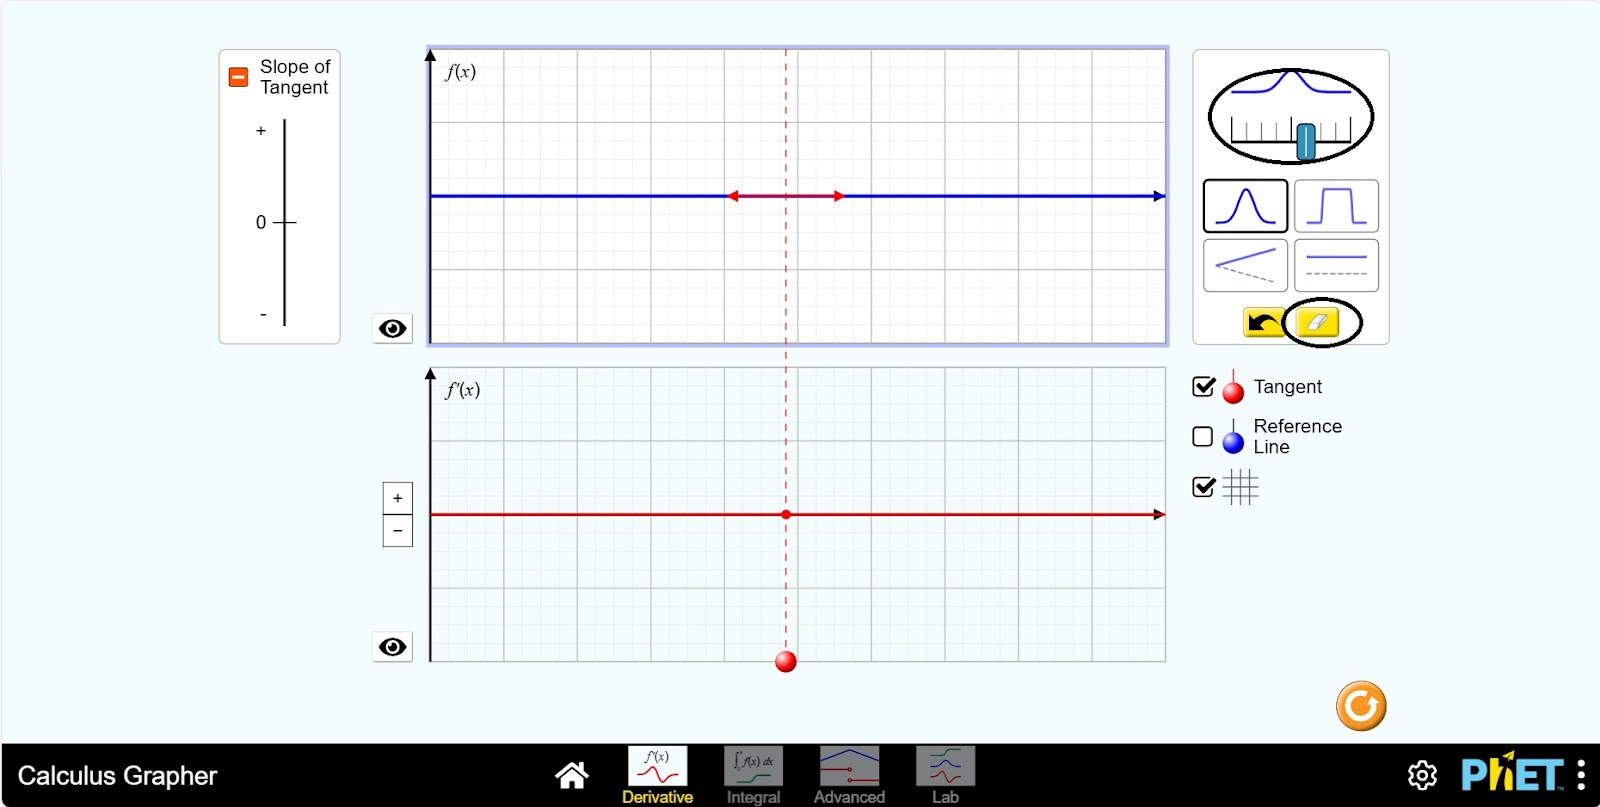
Step 7. Draw the graph by raising or lowering the blue line along the OX axis. Examine the graphs of the functions f(x) and f'(x) and the movement of the tangent along the graph. If the graph of the derivative is not displayed completely in the plane, you can click the “-” button and zoom out.
Step 8. Delete the graph on the plane by clicking on the eraser. Select the second type of graph. The function f(x) is a complex function. Draw the graph by moving the blue line up or down.
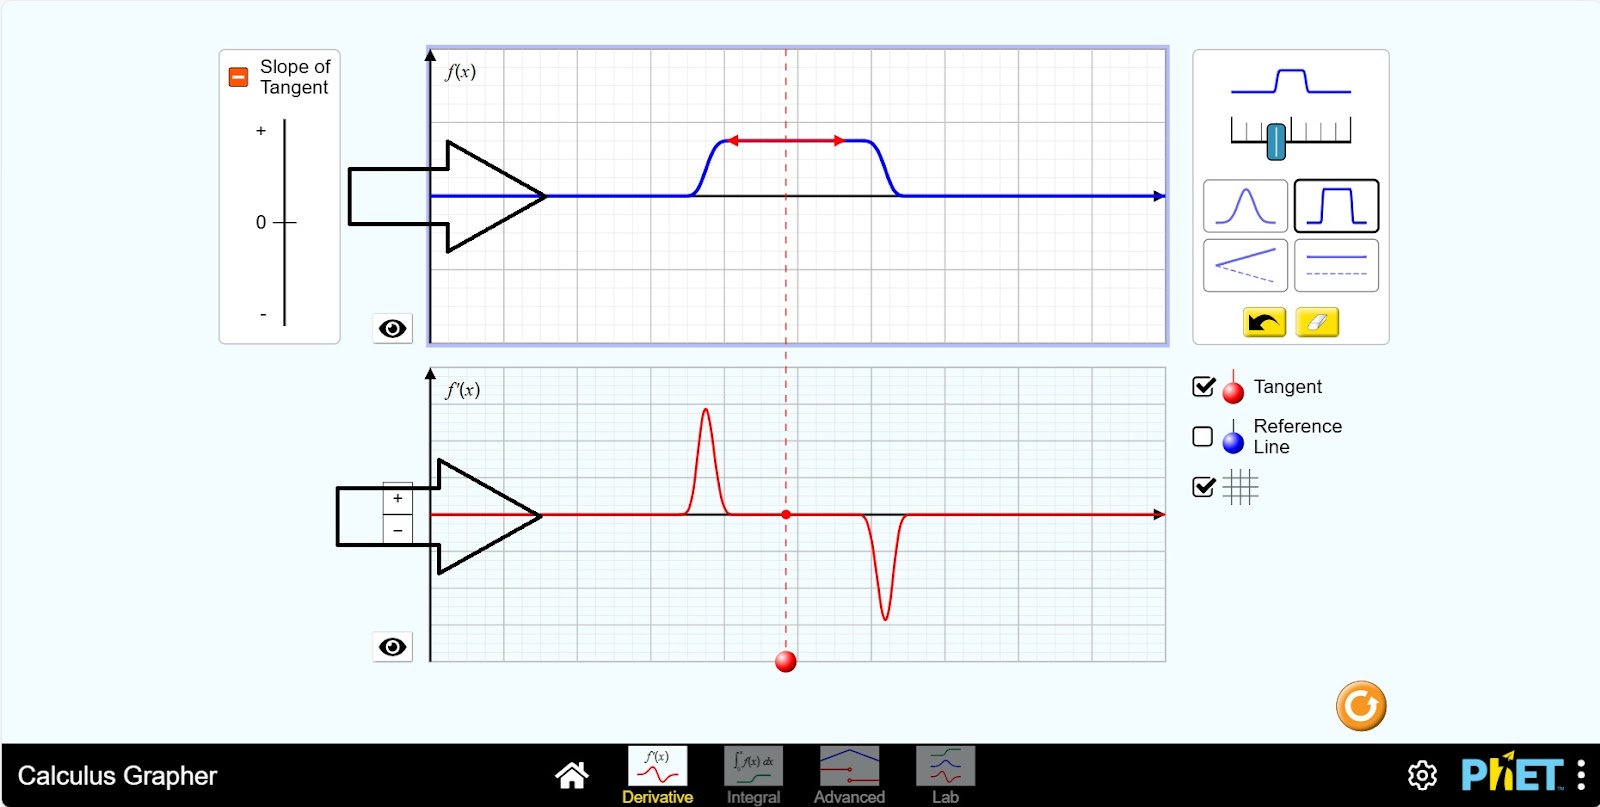
Step 9. Examine the graphs of the functions f(x) and f'(x) and the movement of the tangent on the graph.
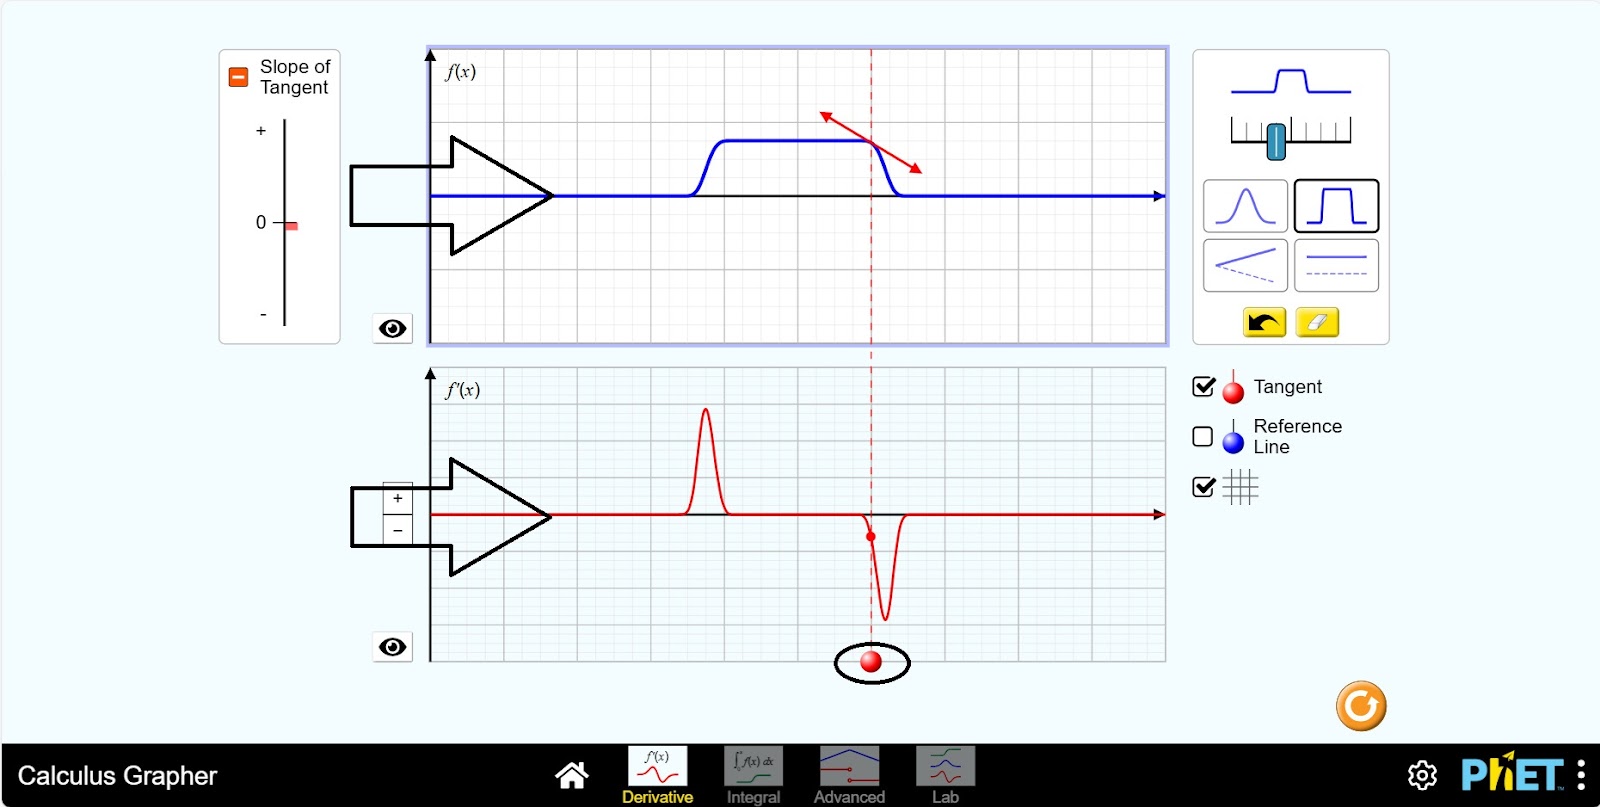
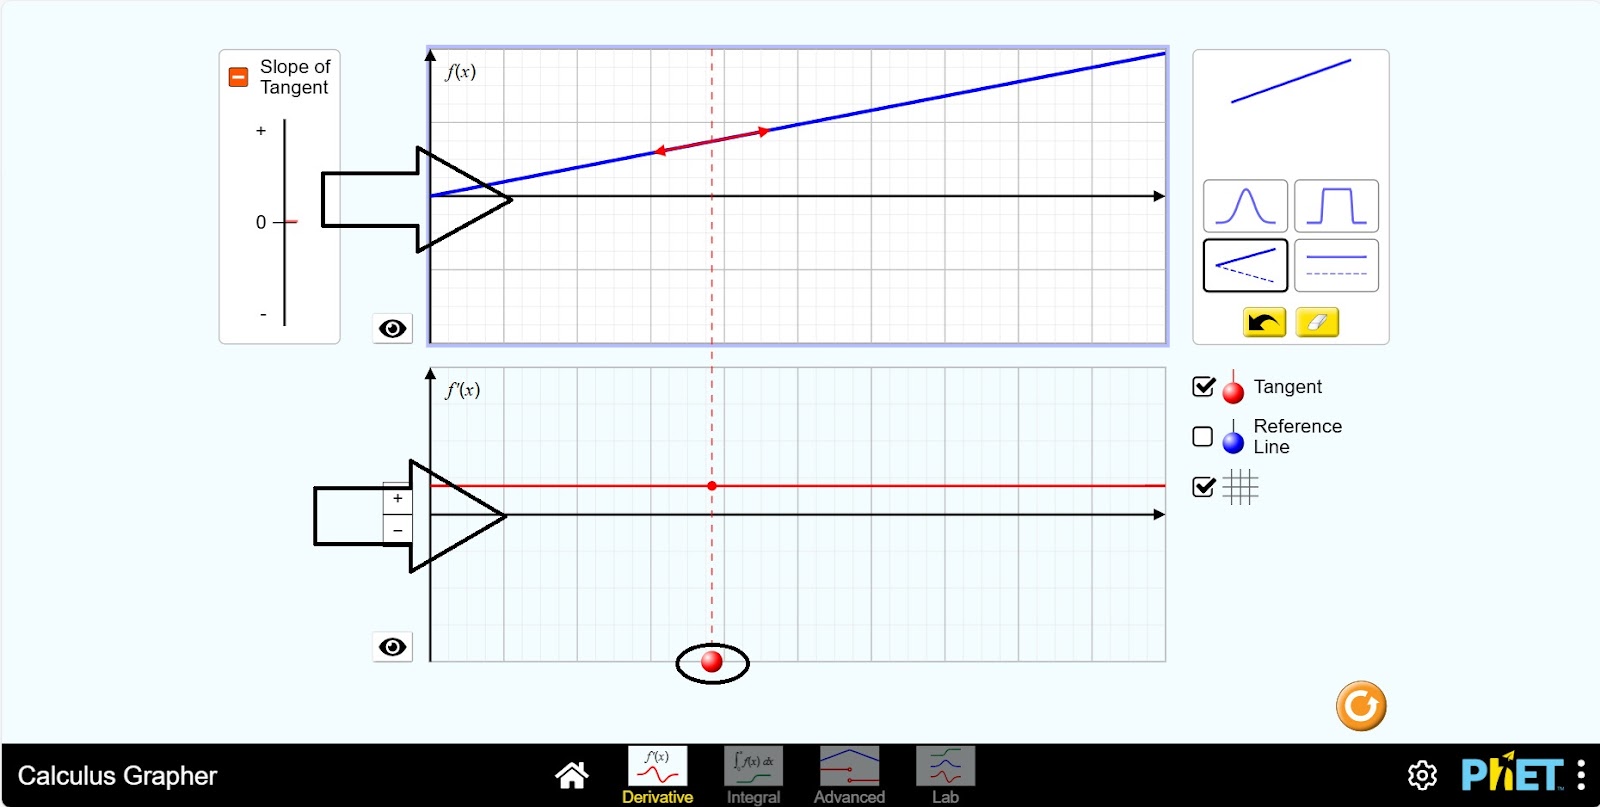
Step 10. Delete the graph in the plane by clicking on the eraser. Select the third type of graph. Here f(x)=±kx. Draw the graph by raising or lowering the blue line along the OX axis.
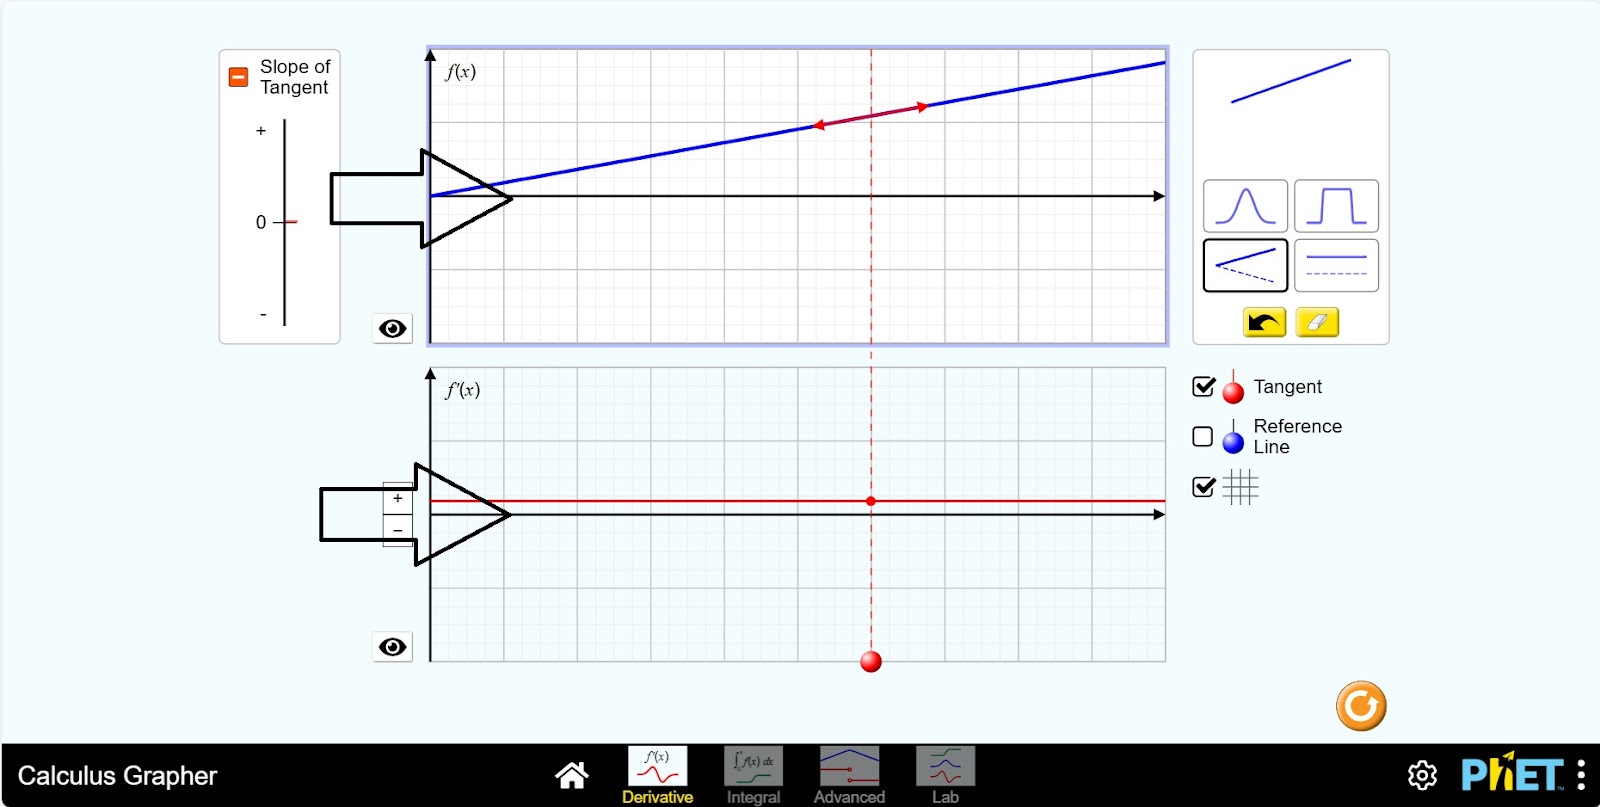
Step 11. You have f'(x) = ±k. Study the graphs of the functions f(x) and f'(x) and the movement of the tangent along the graph.
Step 12. Delete the graph in the plane by clicking on the eraser. Select the type of the fourth graph. Here f(x)=±k. Draw the graph by raising or lowering the blue line along the OX axis.
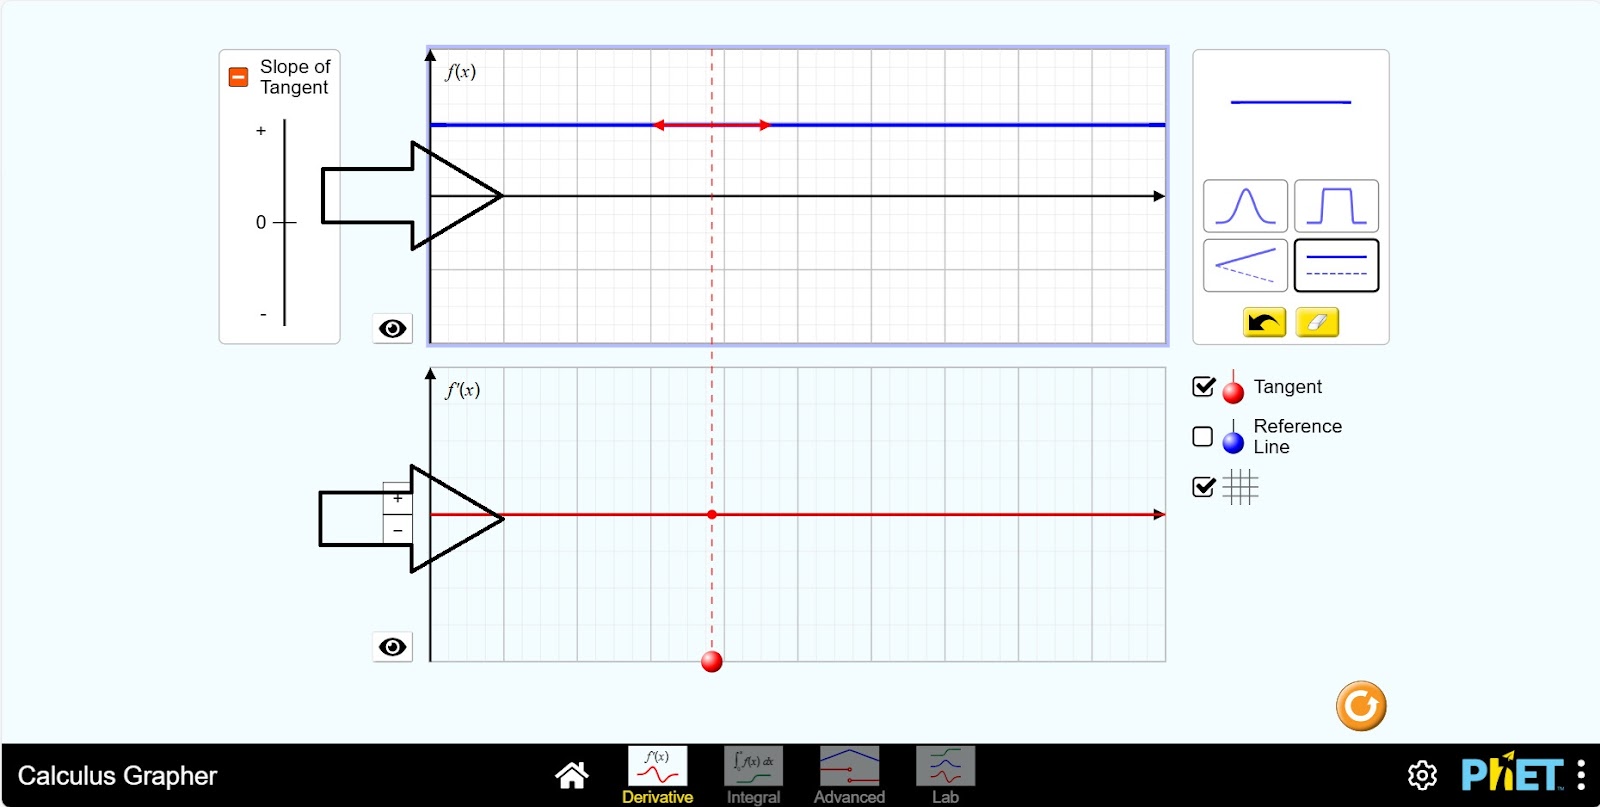
Step 13. You have f'(x)=0. Study the graphs of the functions f(x) and f'(x) and the movement of the tangent along the graph.
Conclusion
Through this virtual activity, students have studied the graphs of derivative functions using graphs of given functions. They have also studied the tangent, one of the most important elements of the graph of a function. Since the use of the derivative is an early, important topic in mathematical analysis, this simulation can be very useful for students.