
Ways of conveying dependence between quantities
Unit Rates by PhET Interactive Simulations, University of Colorado Boulder, licensed under CC-BY-4.0 (https://phet.colorado.edu)
Objective:
- To solve problems involving dependencies between quantities;
- Know the ways of expressing dependence between quantities;
- Write a formula of dependence based on the description.
This virtual activity is designed to be used in math lessons in the next chapter:
- Grade 6. “Dependence between quantities”
Theoretical Part
Dependence between quantities:
In the world around us, many quantities are related to each other. For example:
- The price of a good and its quantity: The more the commodity, the more its price.
- Speed and distance traveled: The greater the speed, the greater the distance traveled in a given time.
- Time and work done: The more time a person works, the more work he or she will accomplish.
A dependency is a relationship between two or more quantities in which a change in one quantity causes a change in the other.
Ways to Convey Dependencies
There are several ways to communicate a dependency between quantities:
- Verbal description: The simplest and most direct way.
Example: “The price of an apple is 20 tenge per kilogram.”
- Table: Allows you to visualize the correspondence between the values of quantities.
- Graph: A visual representation of the relationship in the form of a line on a coordinate plane.
- Formula: The most accurate and compact way to express a relationship.
Create a formula based on the description
- Identify the quantities: Identify the quantities involved in the relationship.
- Establish a relationship: Understand how the quantities are related (directly proportional, inversely proportional, etc.).
- Choose letter symbols: Choose appropriate letters to represent the quantities.
- Write the formula: Write a mathematical expression that relates the quantities.
Virtual Experiment
In this simulation, students create reports about the relationship between quantities. As they shop for fruits, vegetables, and candy, they learn about the unit price. Identifies the unit rate and how it is calculated. Develop strategies for using the unit rate to solve problems. In the Shopping Lab, students can set prices directly.
Workflow:
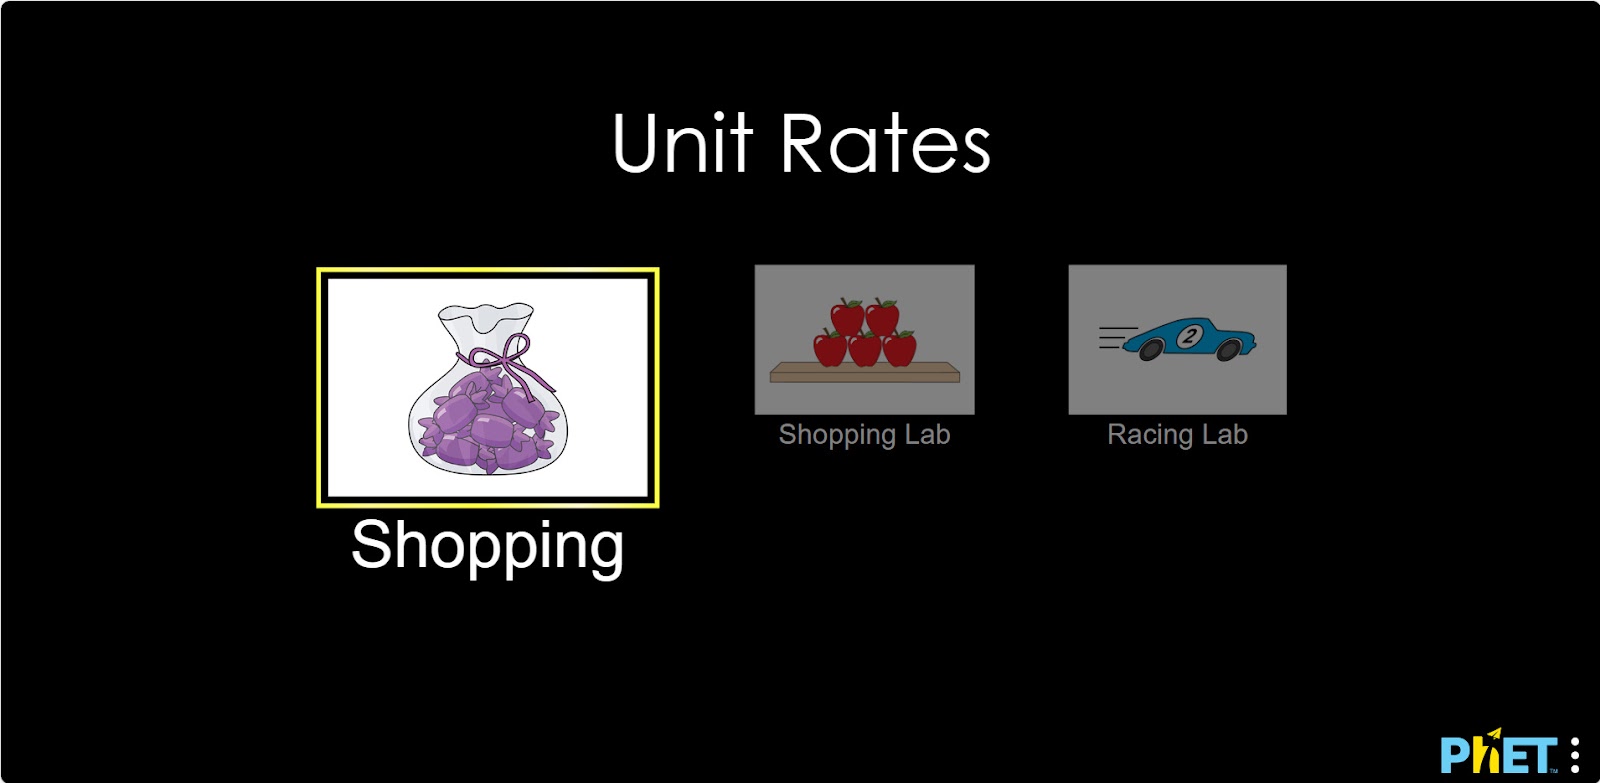
Step 1. You will be given 3 different modes, “Shopping”, “Shopping Lab”, and “Racing Lab”. In this activity, you will work in the first two sections. Open the “Shopping section”.
Shopping Section
Step 2. In the workspace, you will be provided with
- Double Numerical Scale (1);
- Scale (2);
- Fruit in bag (3);
- Taskbar (4);
- A button to change the type of fruit (5);
- Fruit can be changed to vegetables or candy (6);
- Reset button (7).
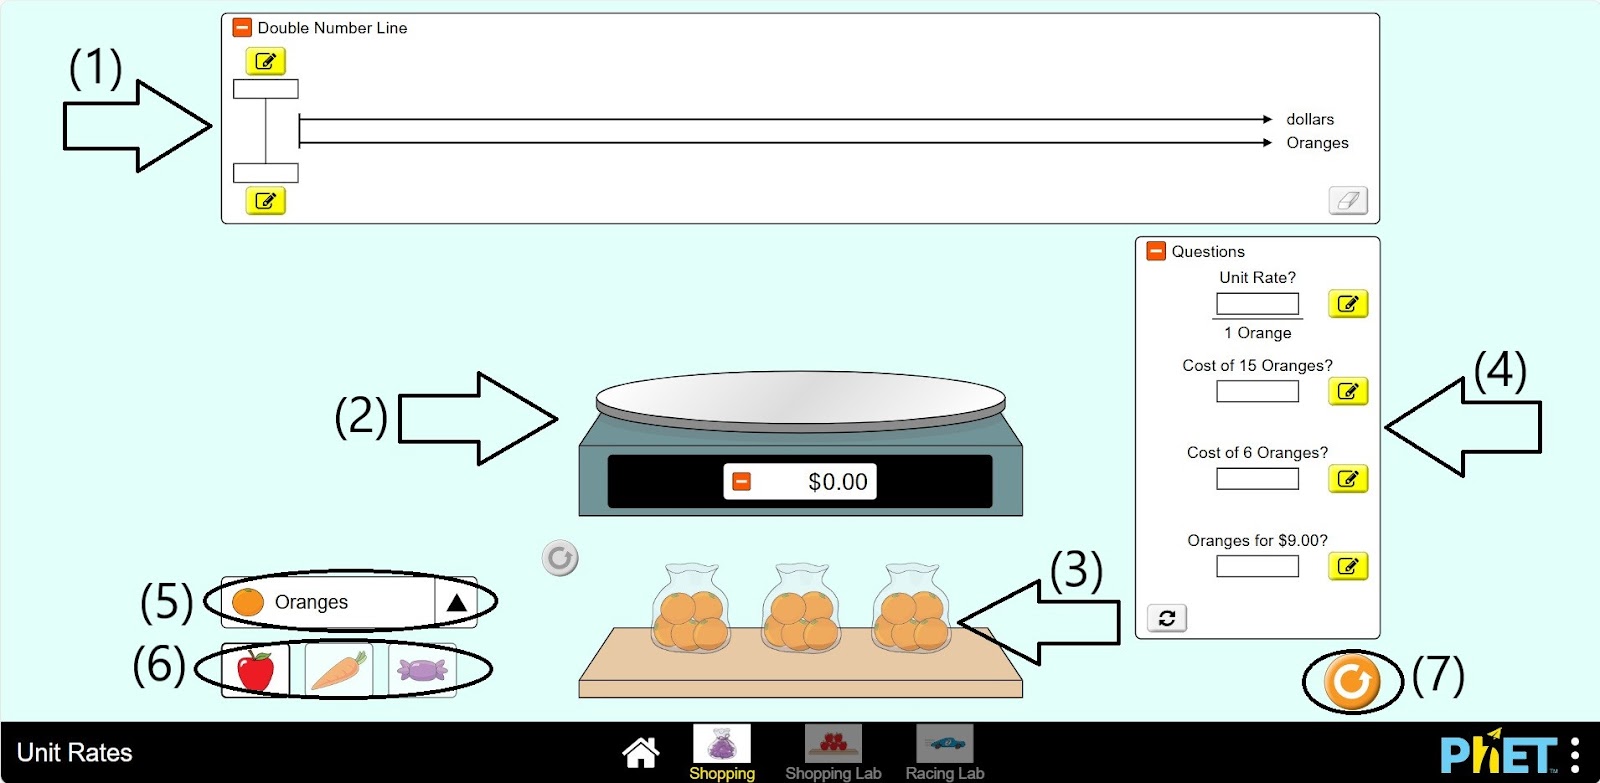
Step 3. Place the orange on the scale.
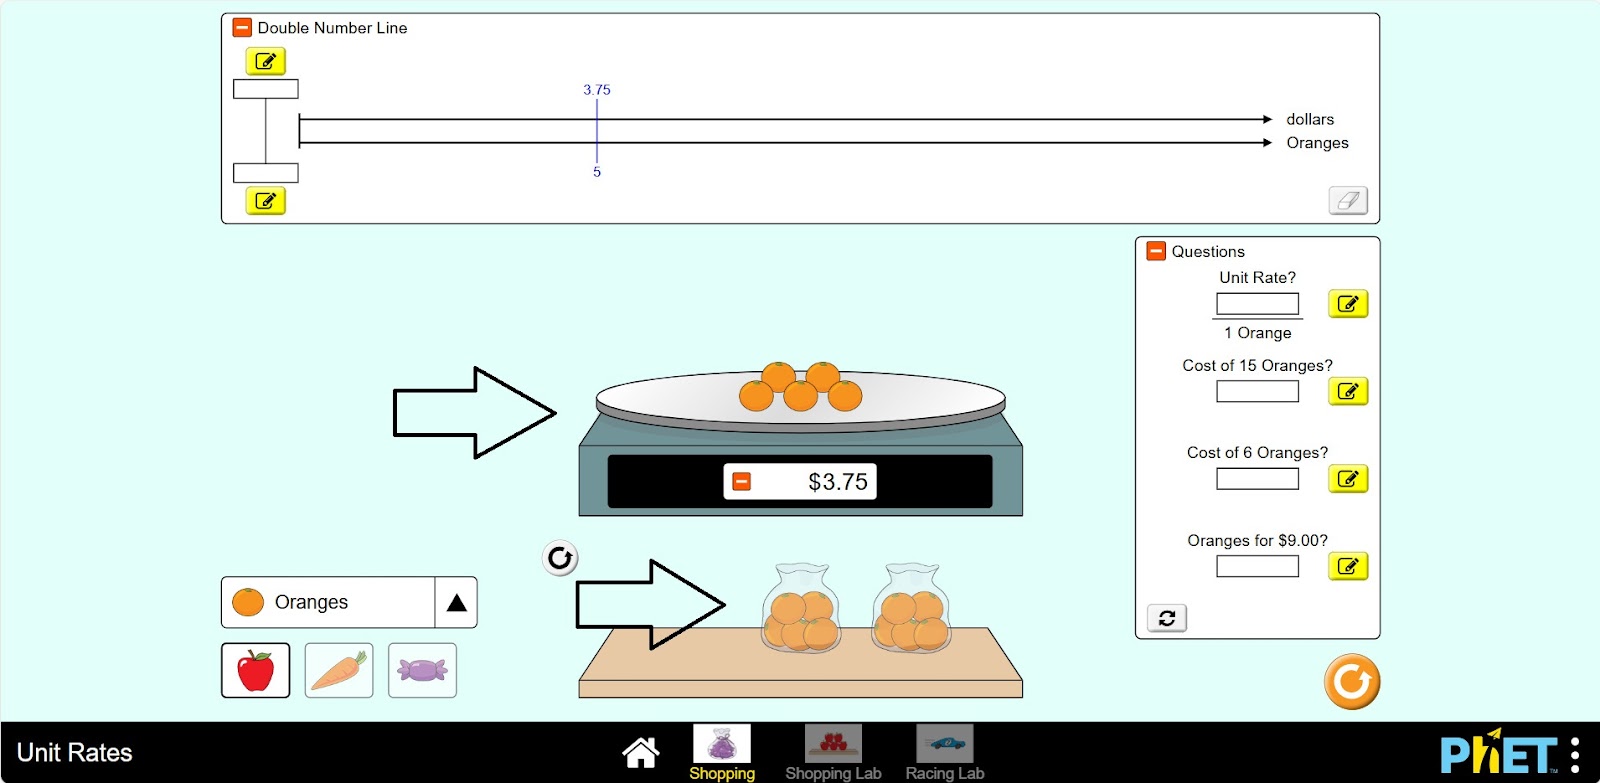
Step 4. Create reports on the taskbar based on the data. You can leave the desired number of oranges on the scale or add more oranges. Examine the data on a double numeric scale.
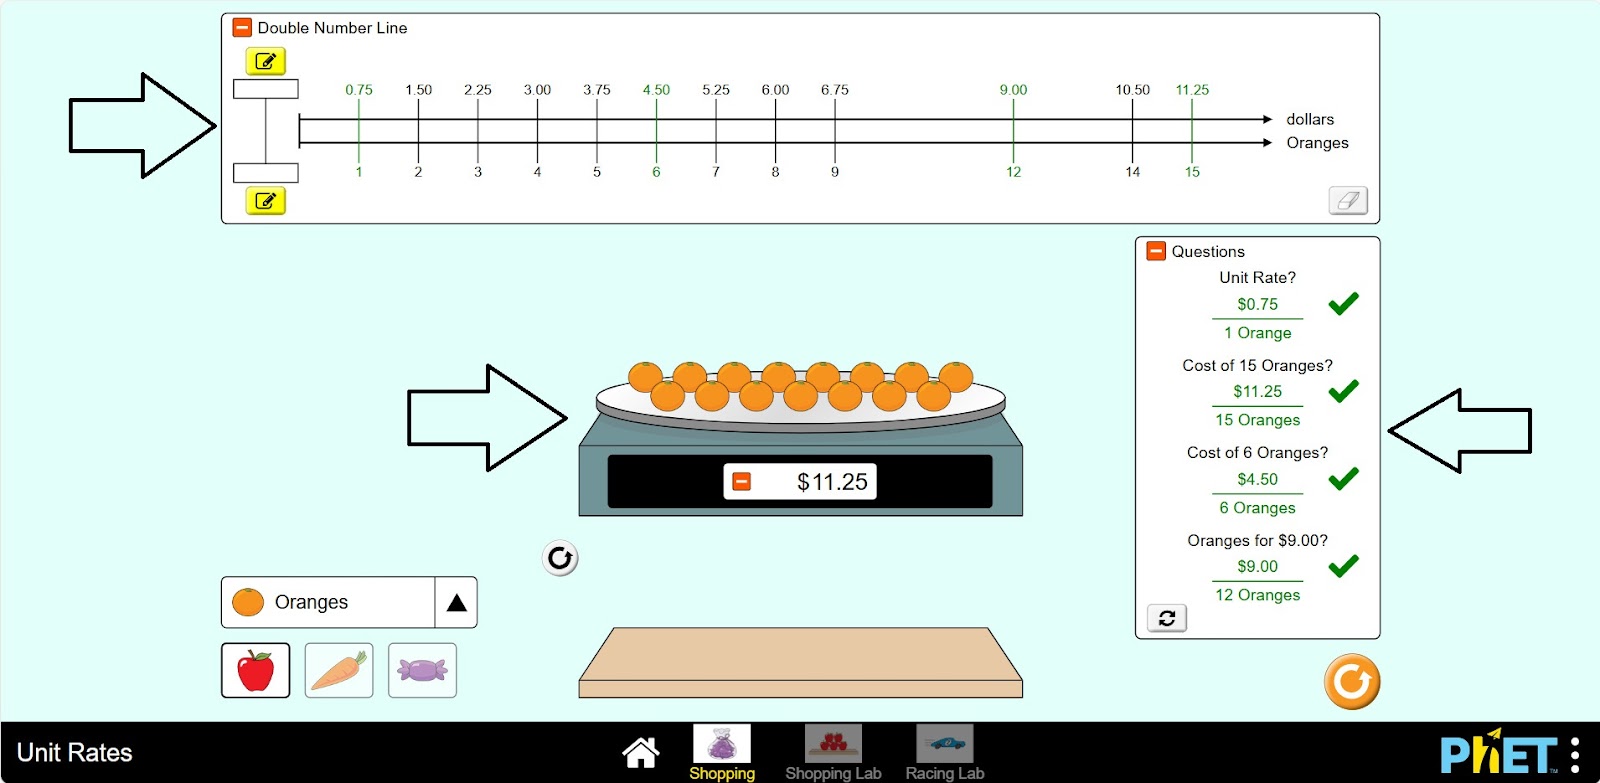
Step 5. You can refresh the Tray and create more reports related to orange.
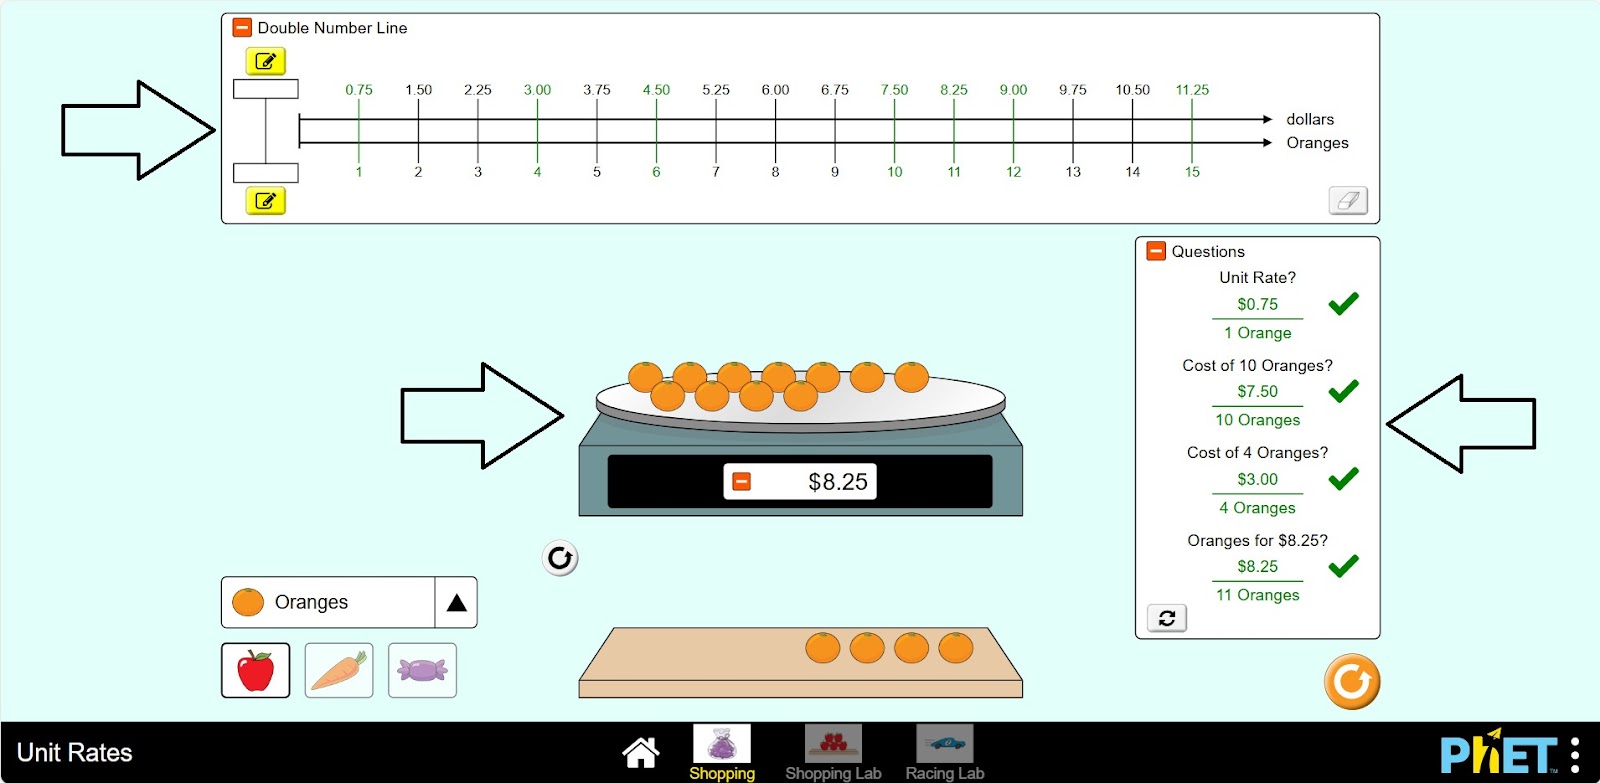
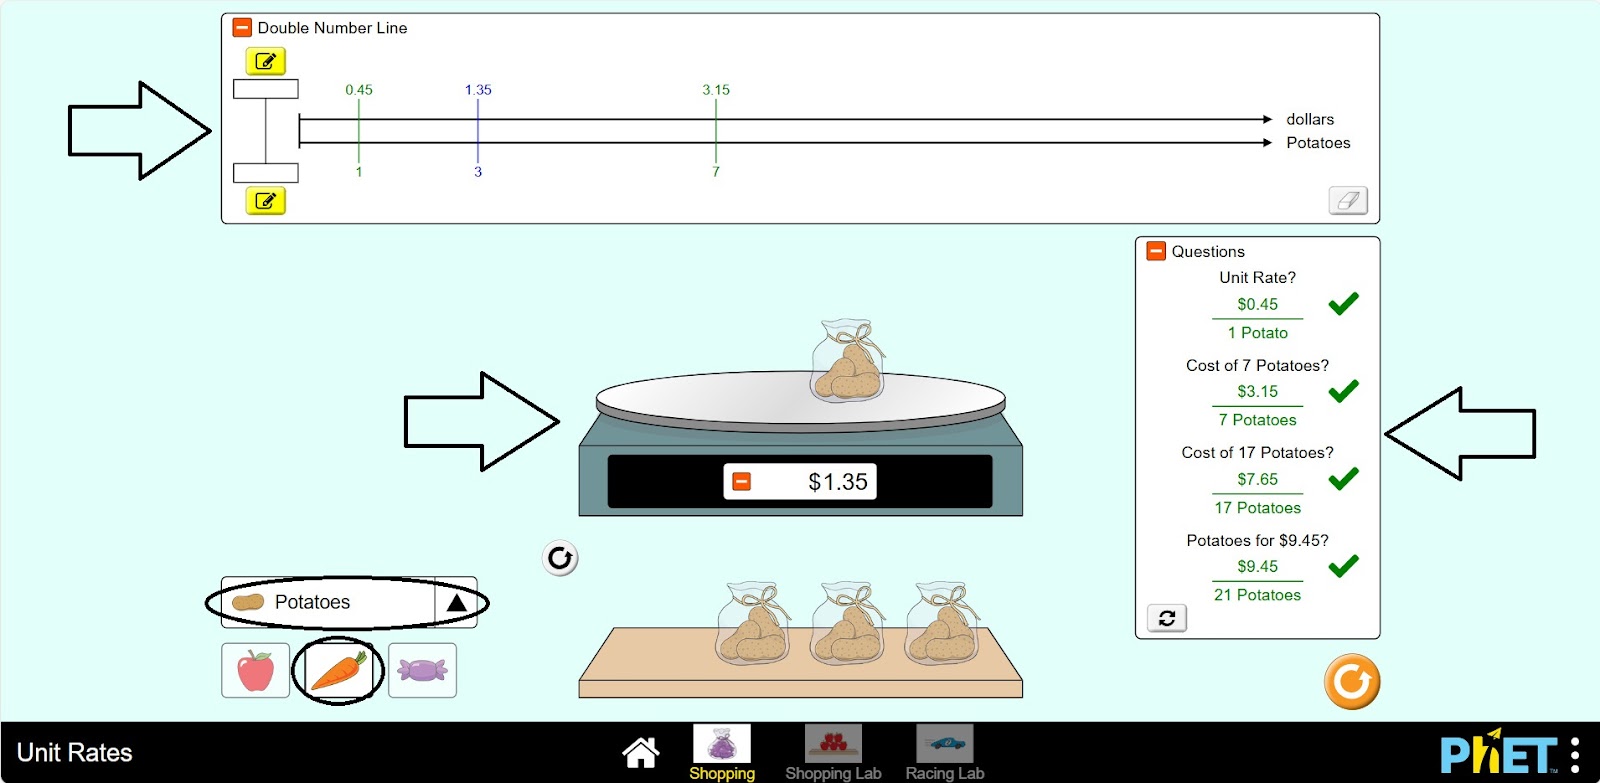
Step 6. Replace the orange with another fruit, vegetable, or candy. Complete the tasks.
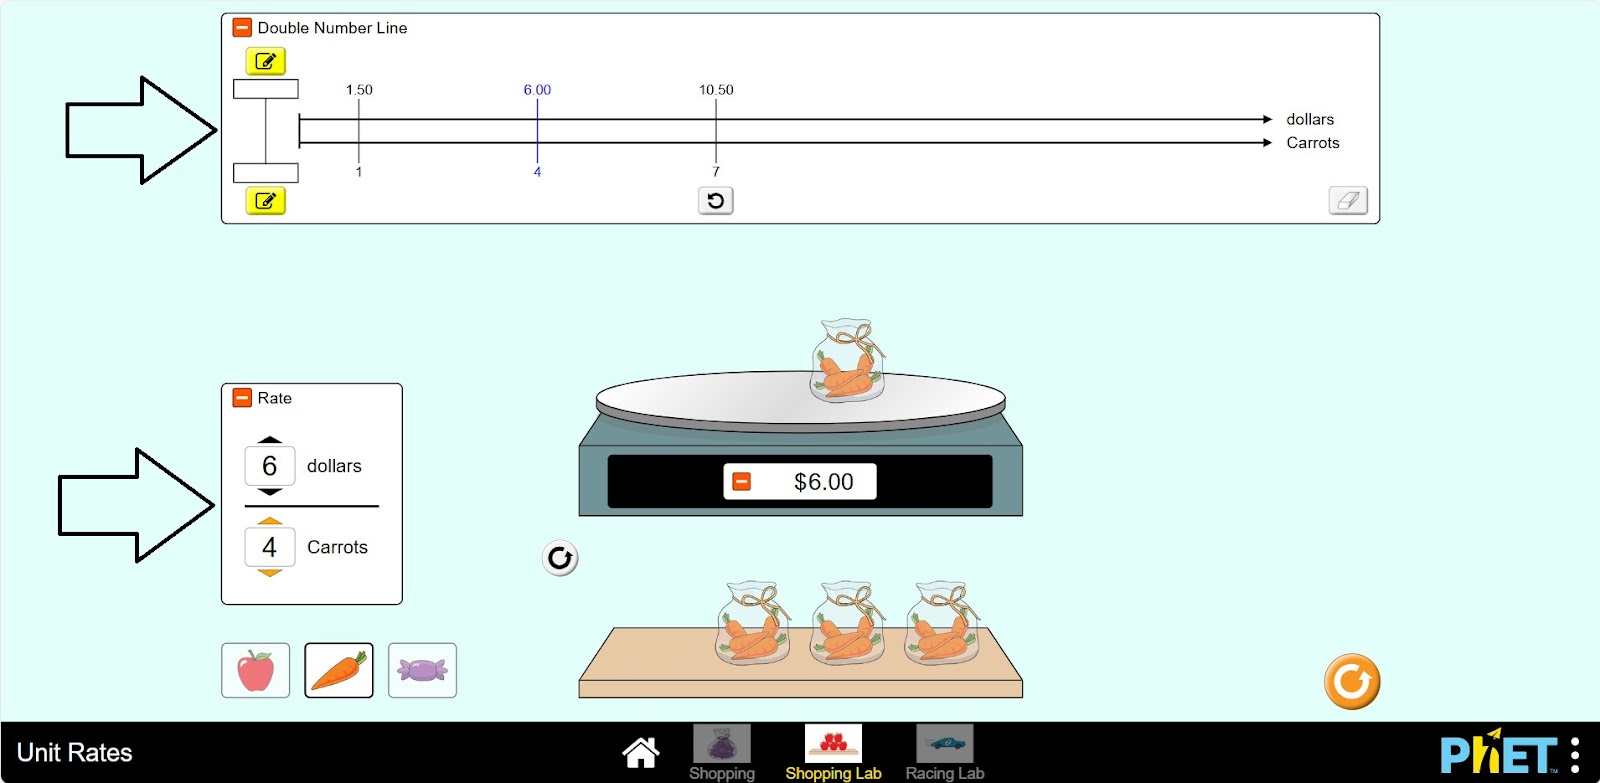
Shopping Lab Section
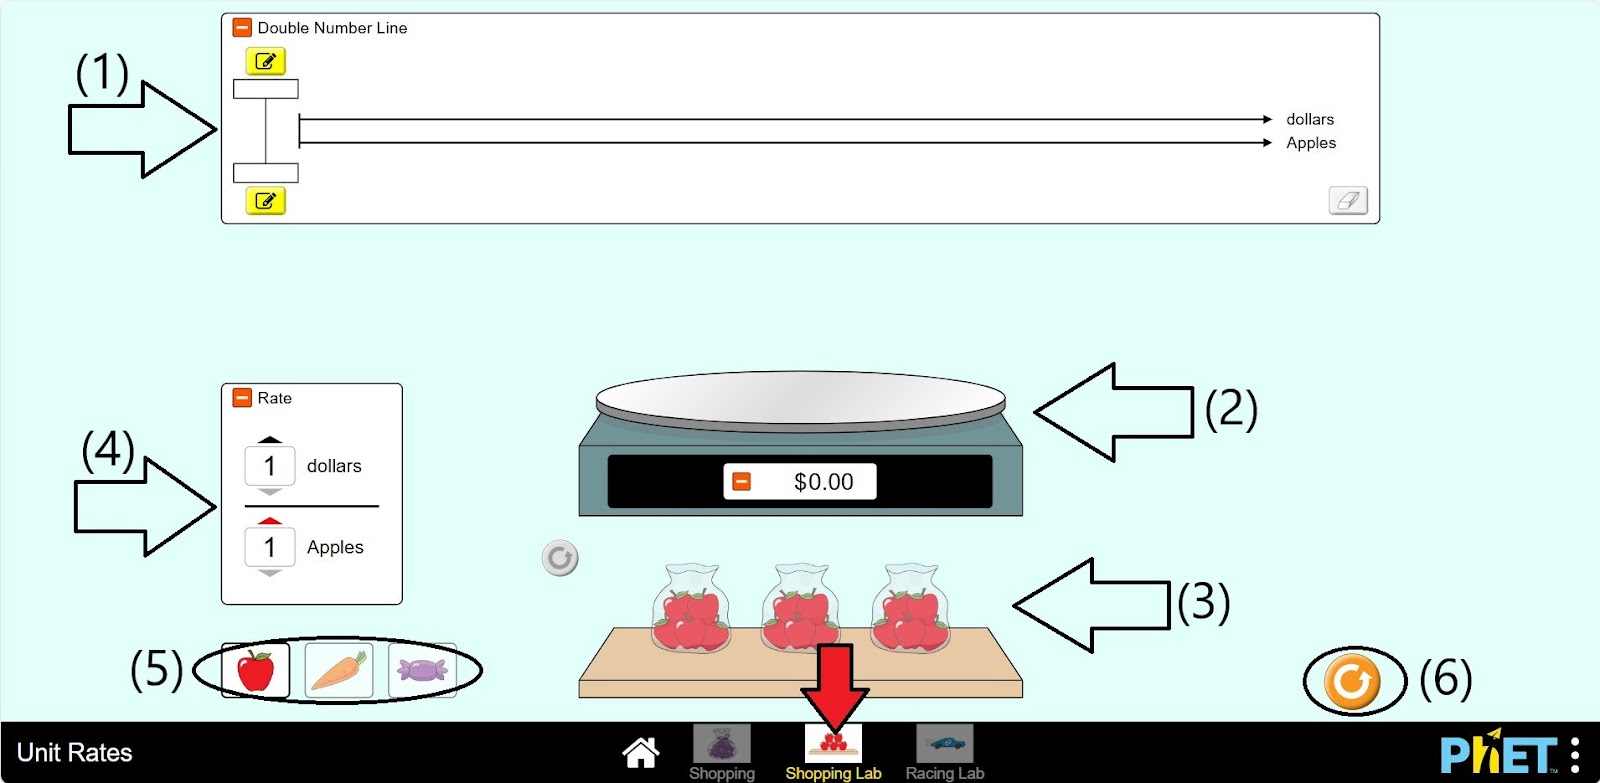
Step 7. Open the Shopping Lab section. In the workspace, you will find
- Double numeric scale (1);
- Scales (2);
- Fruit in a bag (3);
- An apple rating board (4);
- Apples can be replaced by carrots or candy (5);
- Restart button (6).
Step 8. Set the price of an apple. Place the apples on the scale.
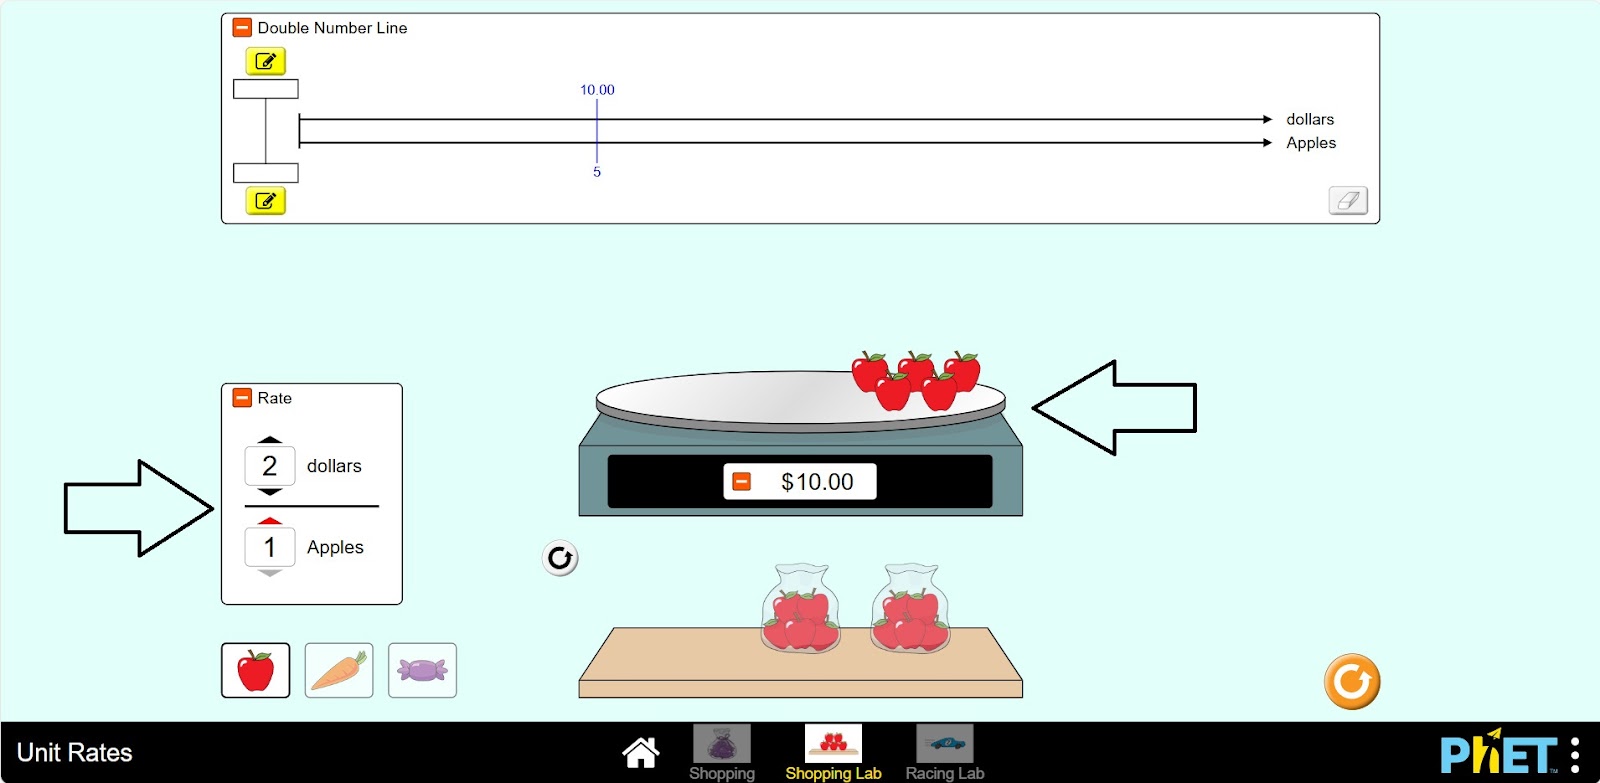
Step 9. Enter the number of apples on the two-digit scale. Calculate and record the corresponding price.
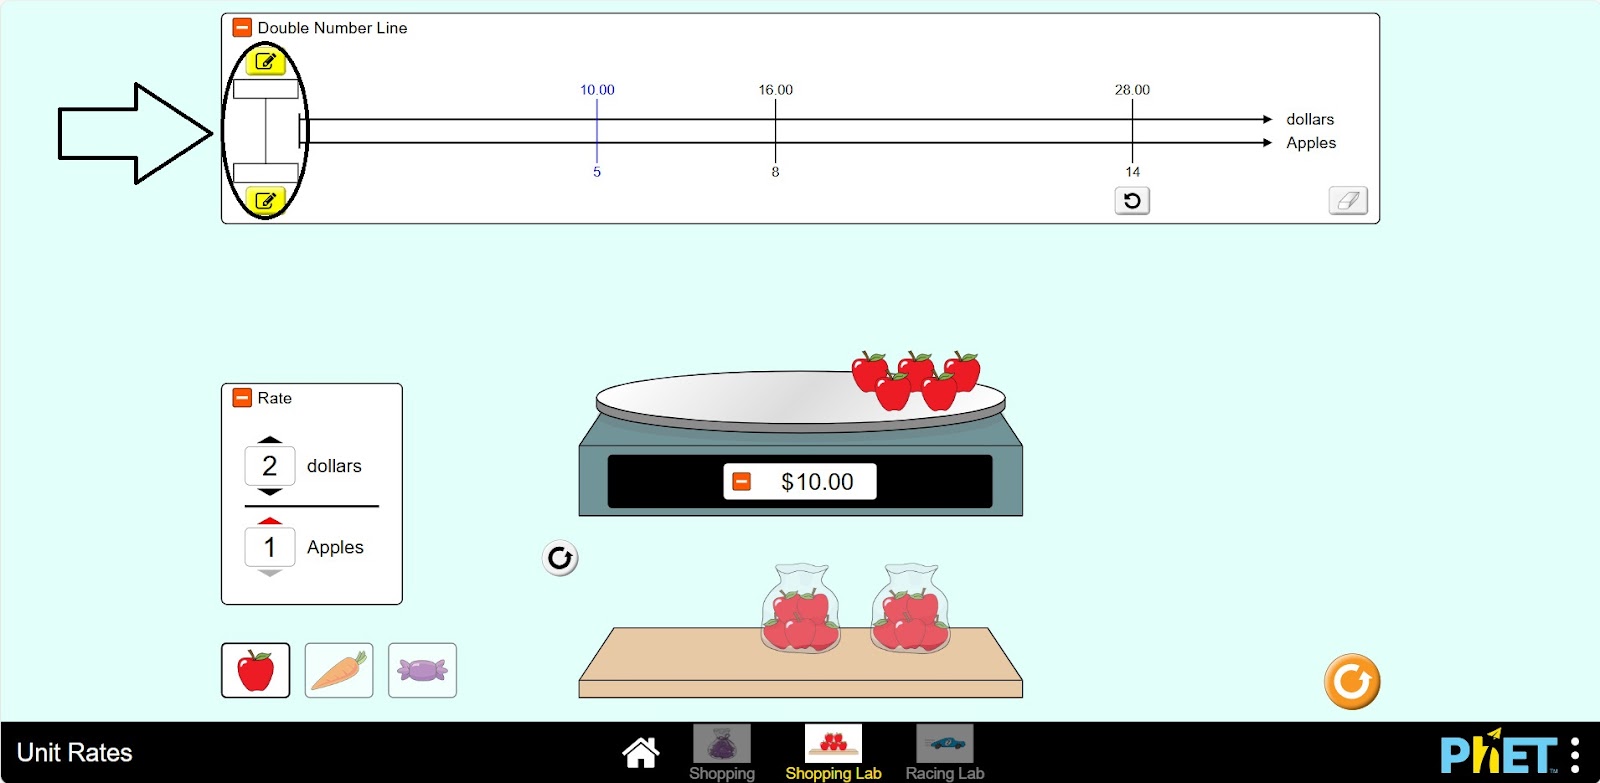
Step 10. You can do several experiments in the lab by changing the two-digit scale, the price, or the apple.
Conclusion
Students have learned about relationships, the dependence between quantities, by working on this simulation. The topic has been illustrated by calculating the price of a good and its quantity.