
Lesson 2
Before you begin, think back to the last lesson.
Ask a few questions.
Ask about your homework.
Now continue to make our diagram.
Practical part
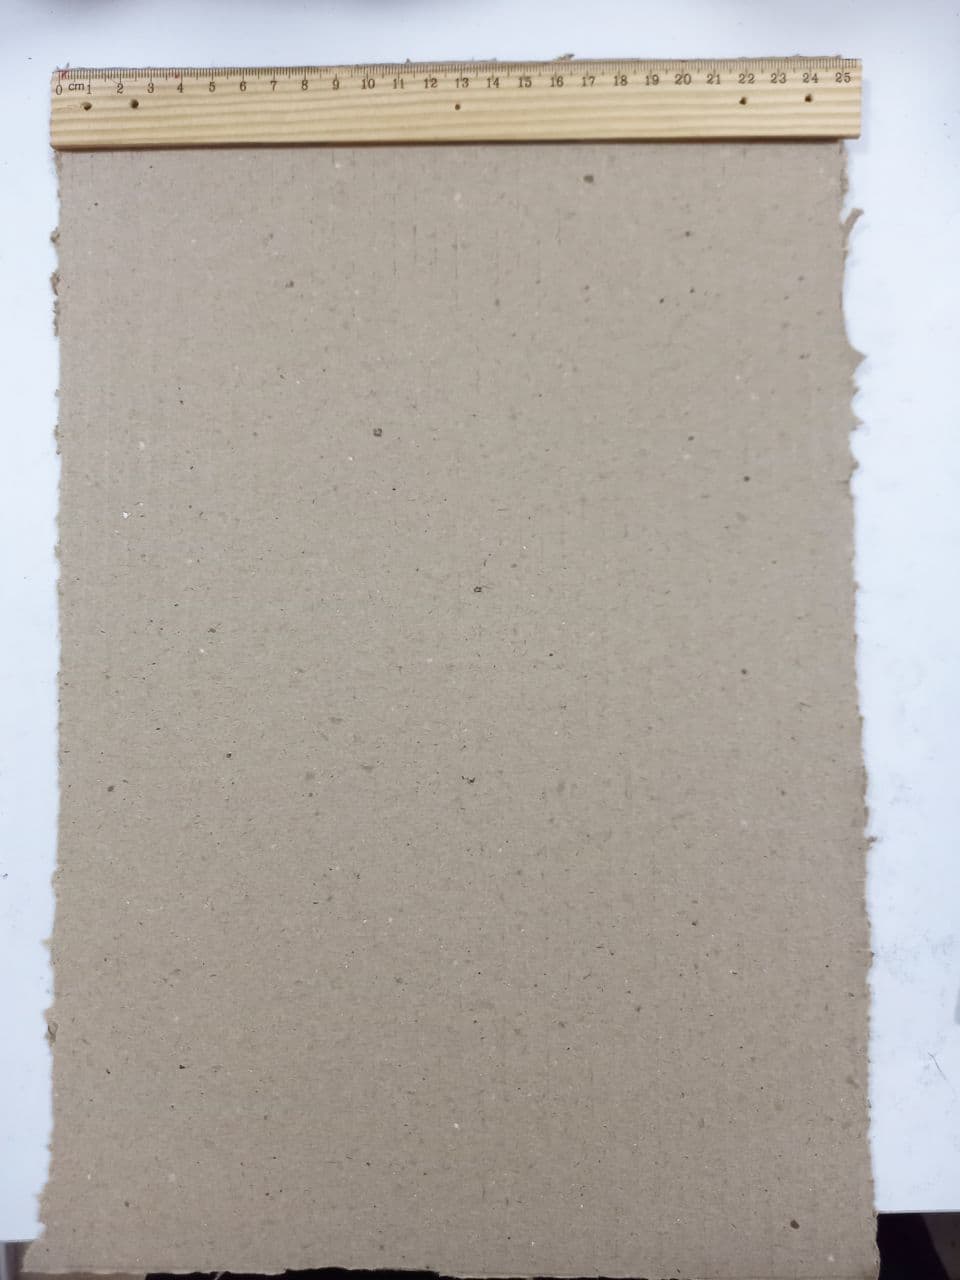
Step 1
Take cardboard, mark the size with a marker and ruler 25×37 and cut with a box cutter (only the teacher uses it)
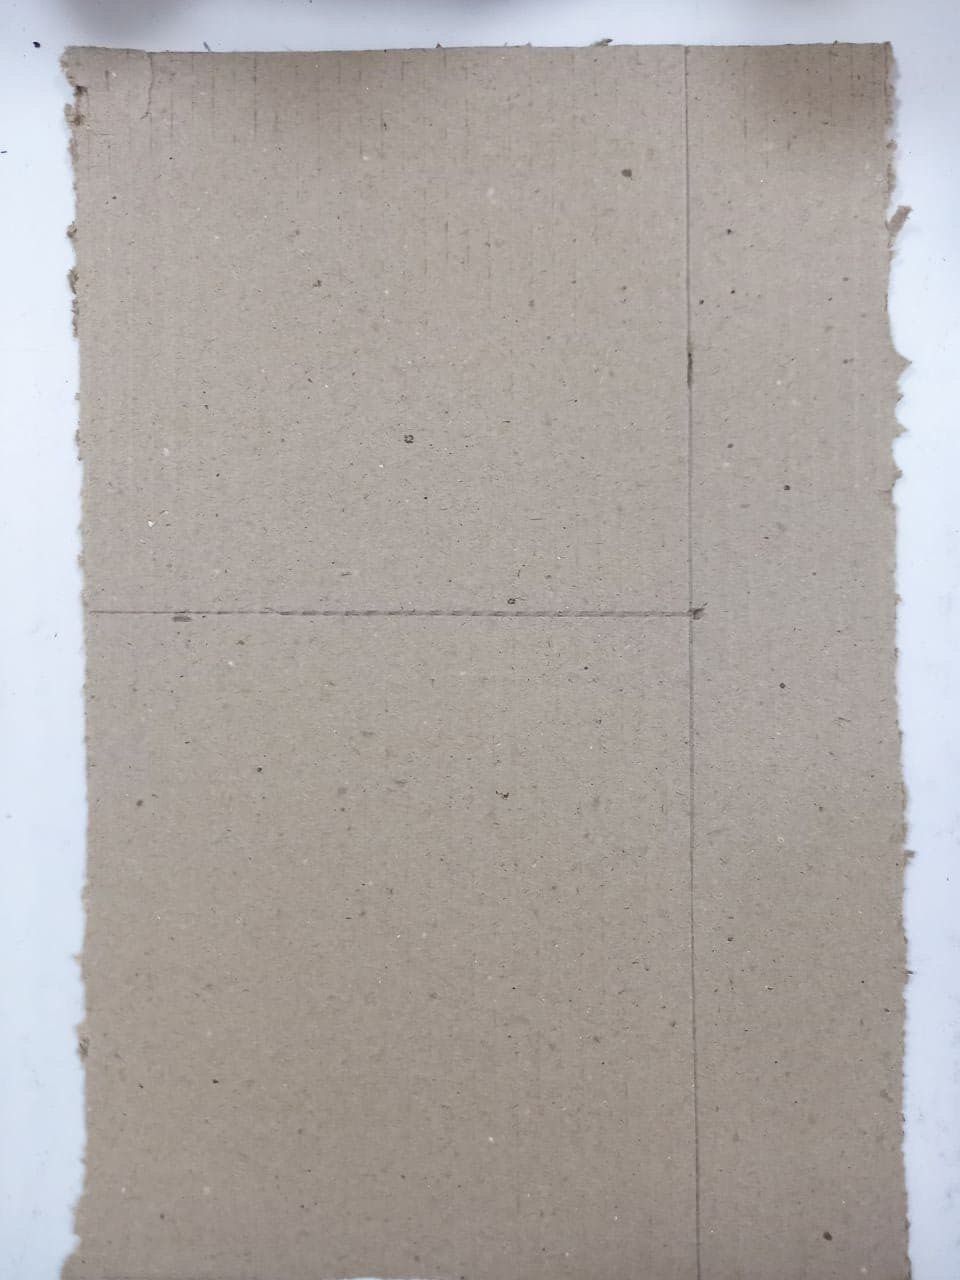
Step 2
Draw a line on cardboard measuring 6.5×37 and in the middle also draw a line, the top 17 cm, the bottom 20 cm
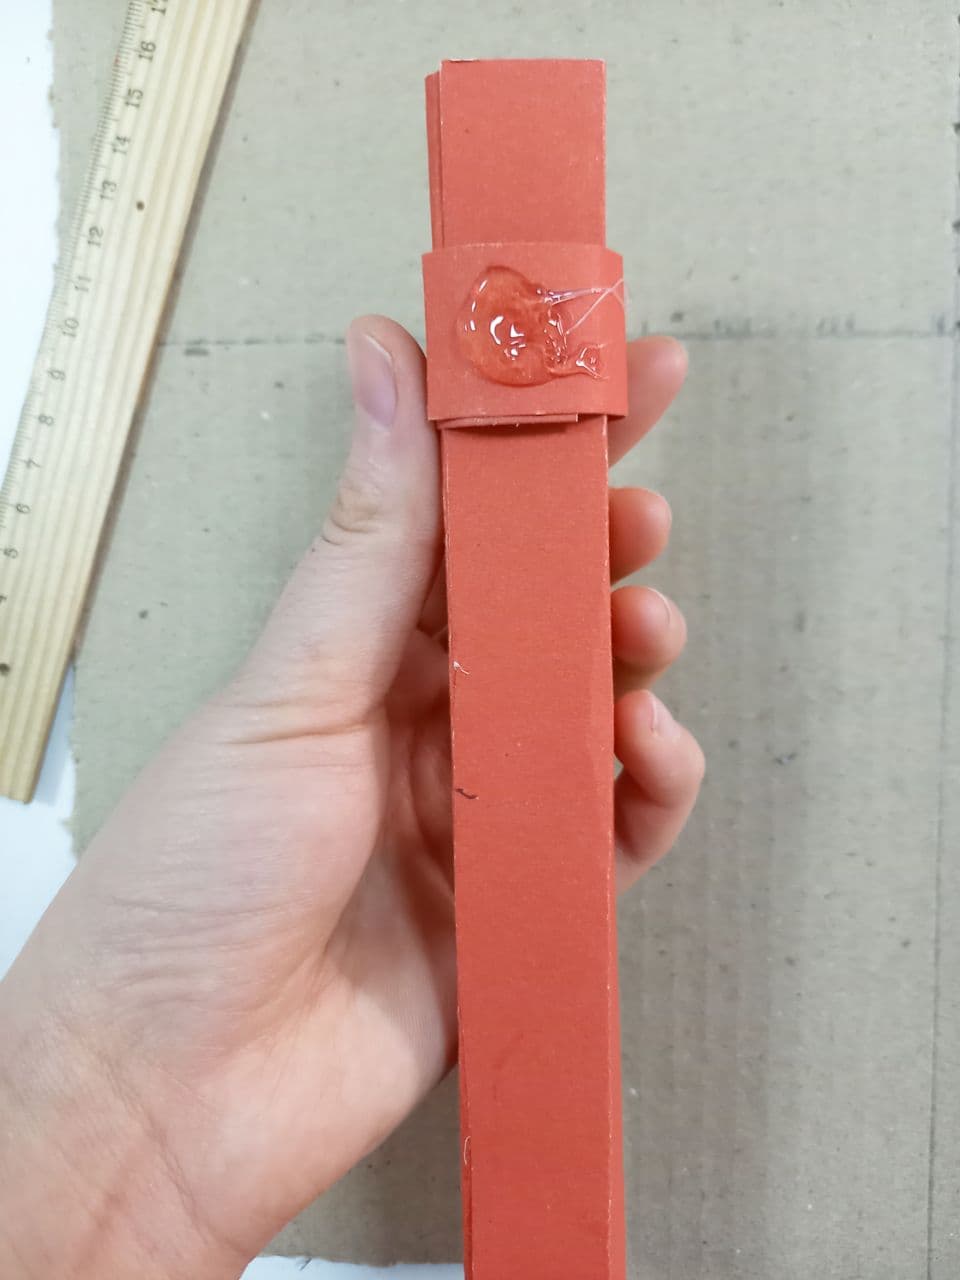
Step 3
Use hot-melt adhesive to glue just the holder onto the cardboard. The tube comes with the holder
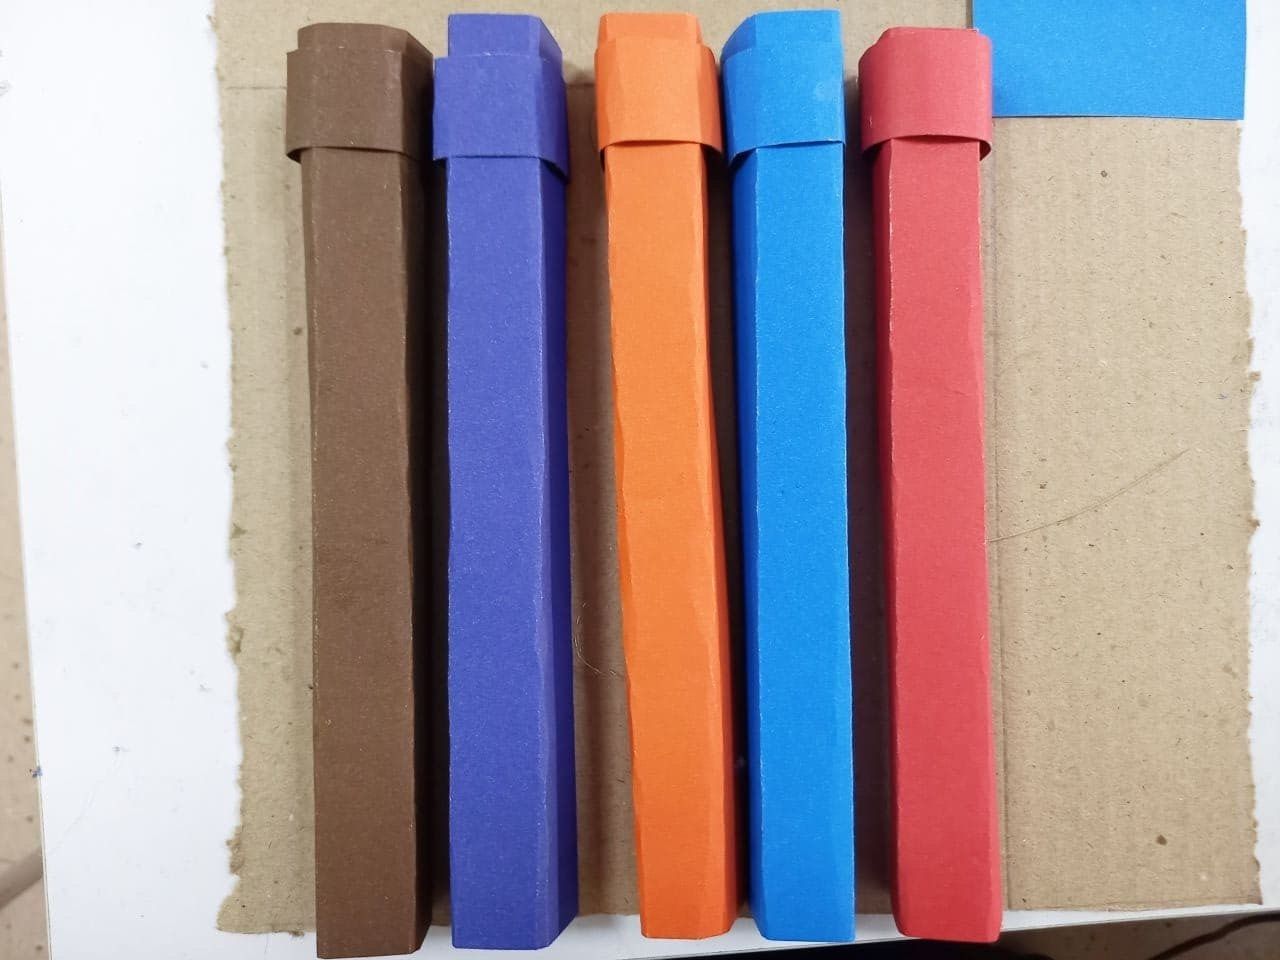
Step 4
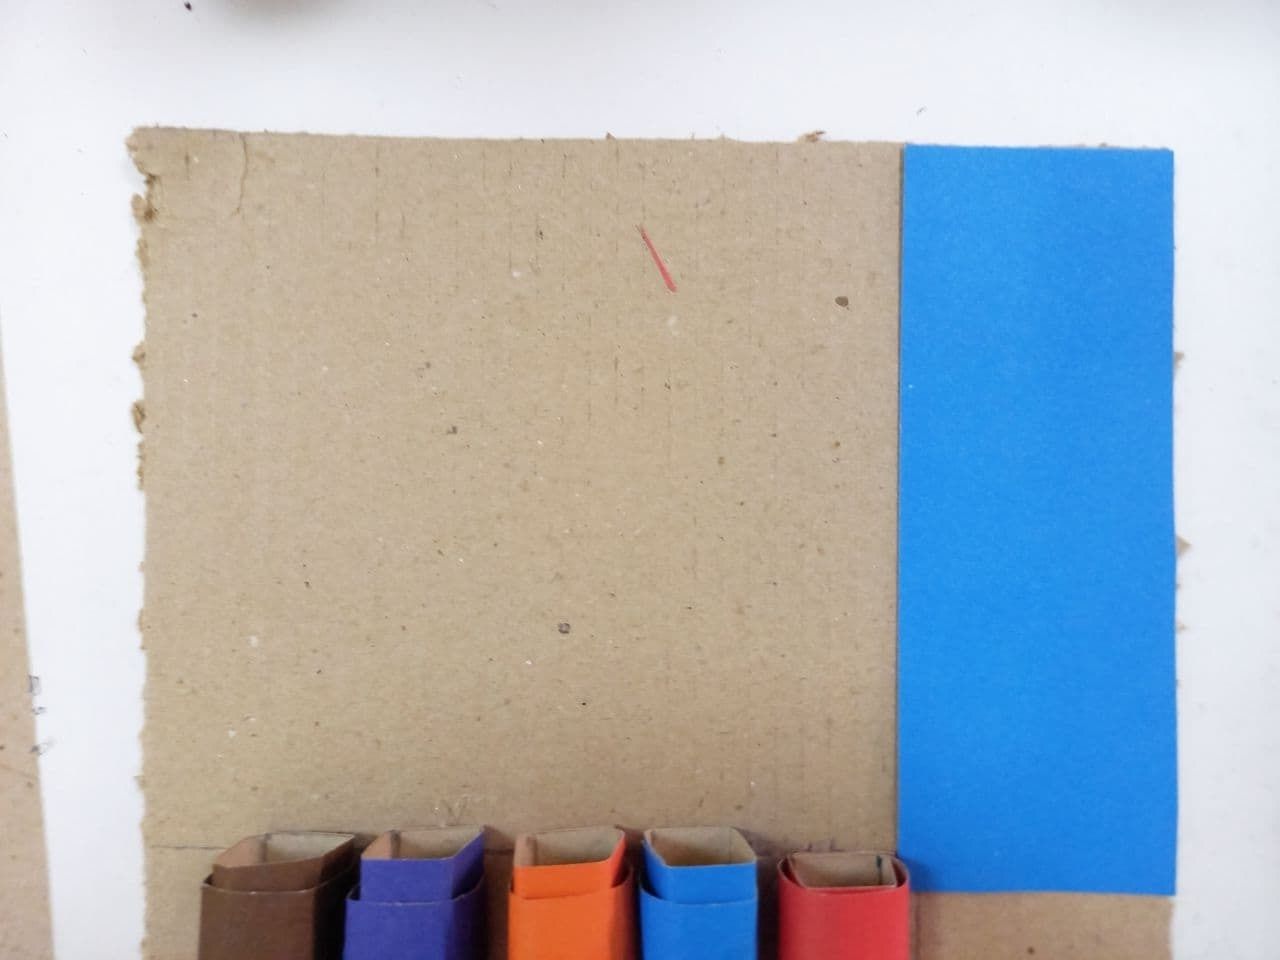
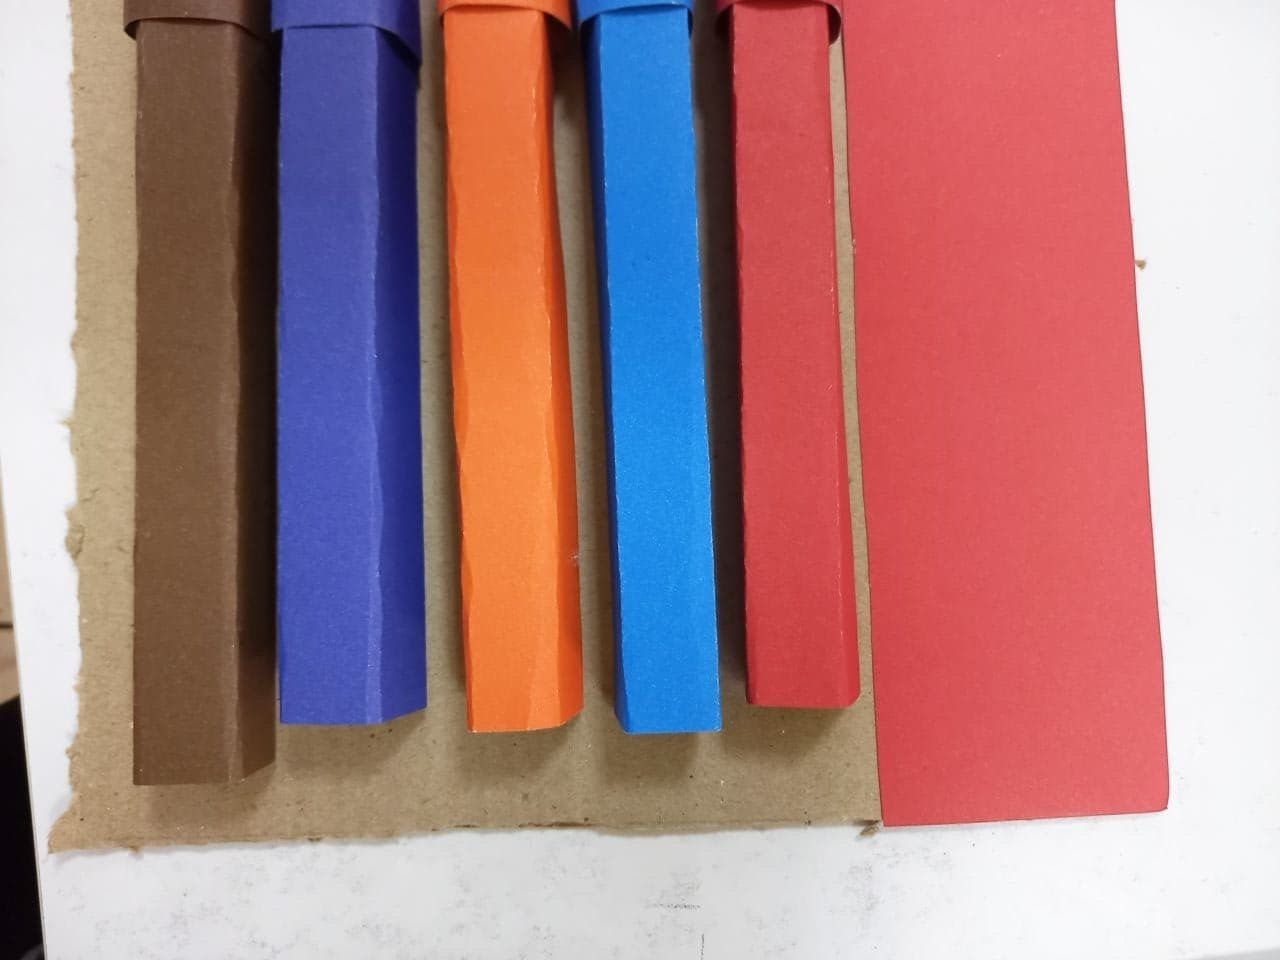
Glue all 5 tubes together in cardboard
Step 5
From the leftover coloured cardboard, we cut a size 6.5×17 to draw the scales, and glue it onto the cardboard from the right to the top
Step 6
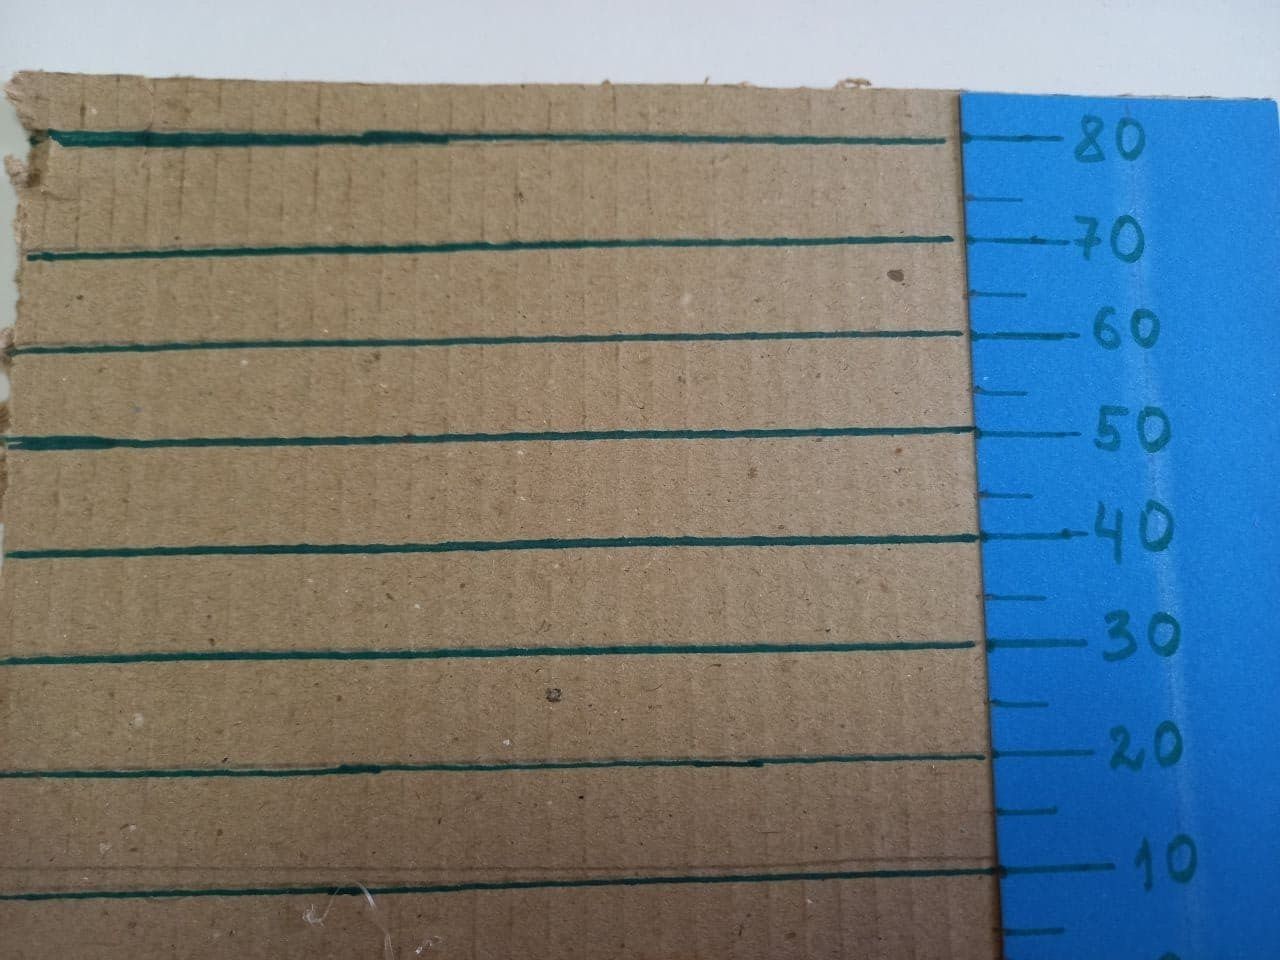
Cut the bottom part in the same way from the rest of the coloured cardboard to a size of 6.7 x 20. And then glue them together
Step 7
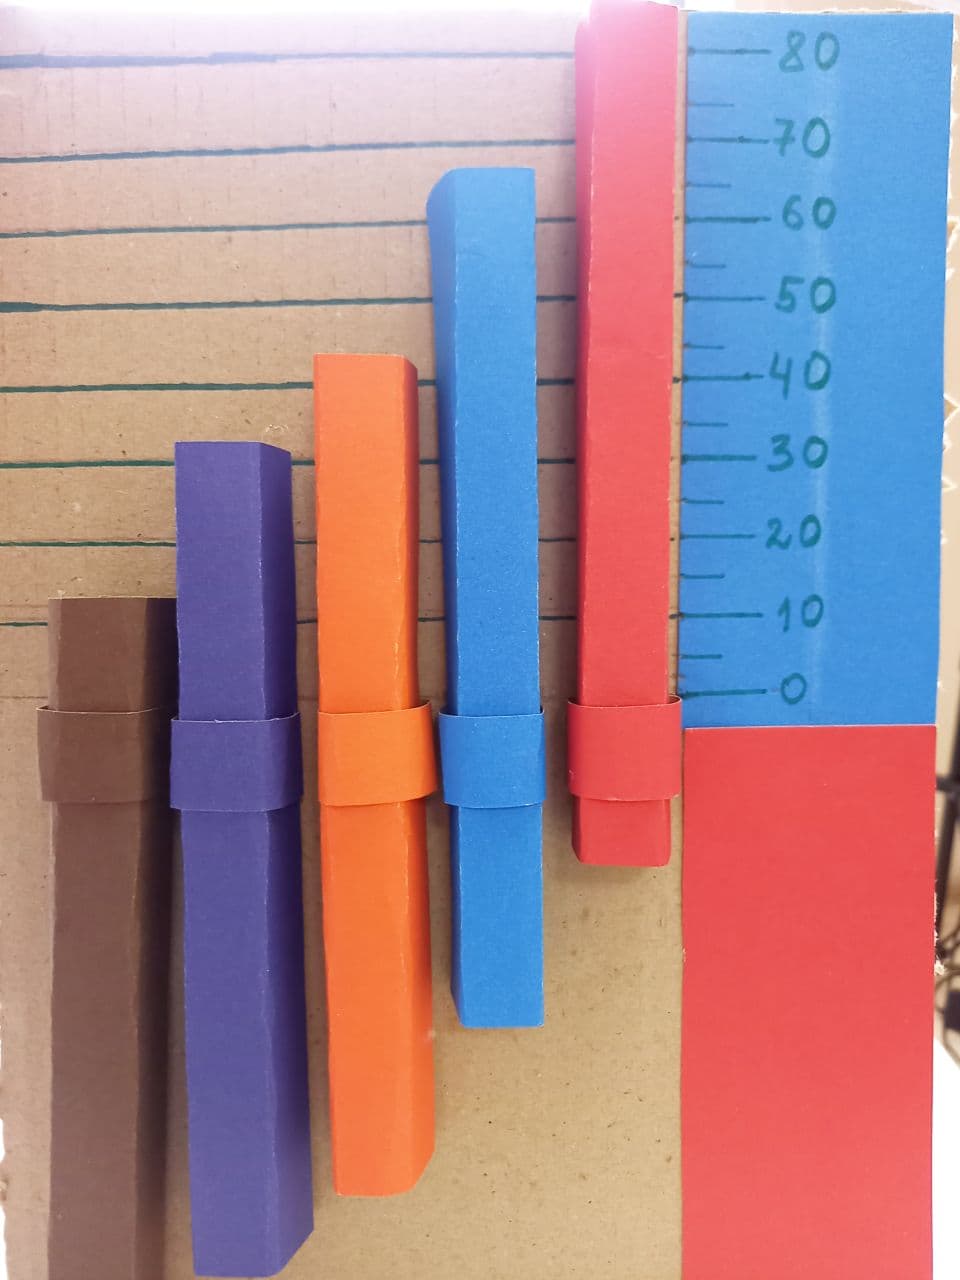
Drawing the scales, using a felt-tip pen
Step 8
Our bar chart is ready!
The diagram is ready! Now let’s use our diagram in the lesson.
Task
Askar, Aidyn, Madiyar, Damir, and Arman jumped in the height in gym class. Askar-80cm, Aidyn-60cm, Madiyar-40cm, Damir-50cm, Arman-70cm.
Questions:
1) Show these numbers on the diagram.
2) Which of the boys won first place?
3) How high were Arman and Aydin able to reach?
4) How many centimetres was Aydın’s jump higher than Damir’s?
Conclusion
In this lesson the pupils made a bar graph with their own hands. And with the help of the diagram they learned how to solve problems

On this project each pupil is awarded a STEAM title, by category:
– You have independently, researched diagrams, made your own diagram and also worked with numbers you are a real – analyst!
– You, working as part of a group, have developed teamwork skills.
Еvaluation
